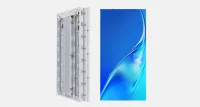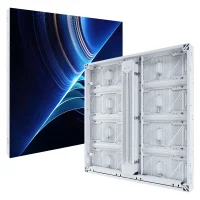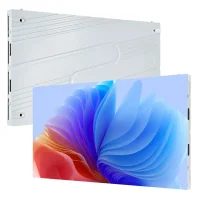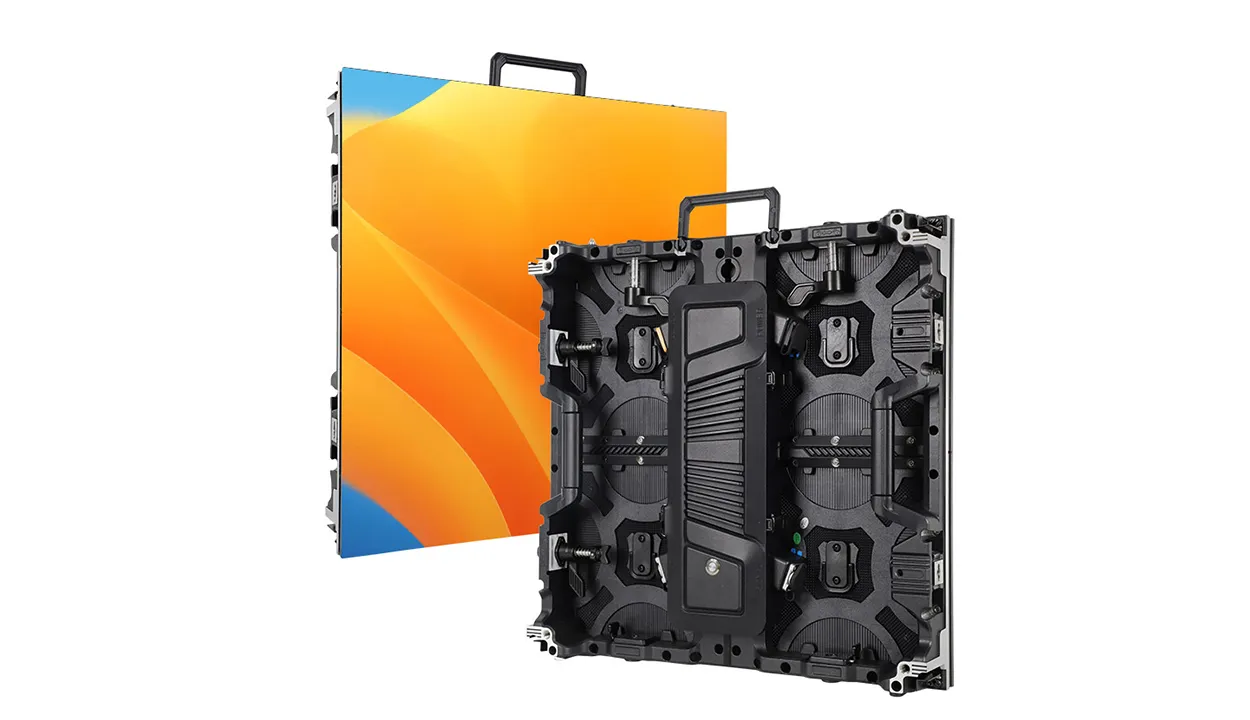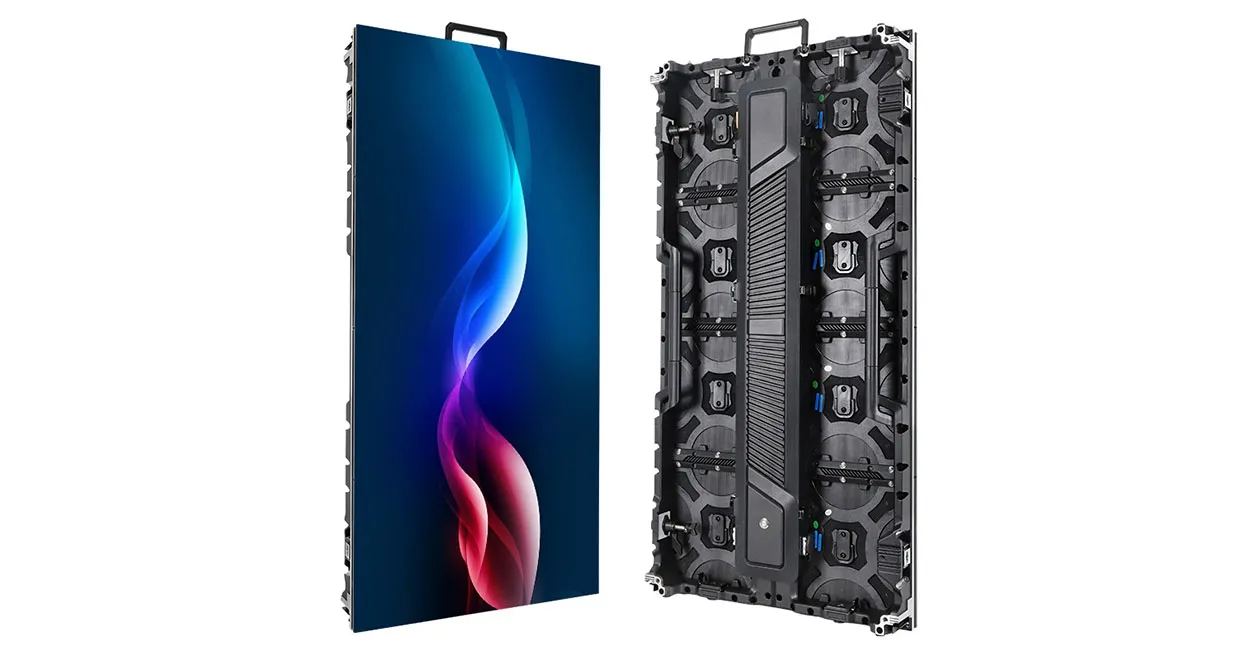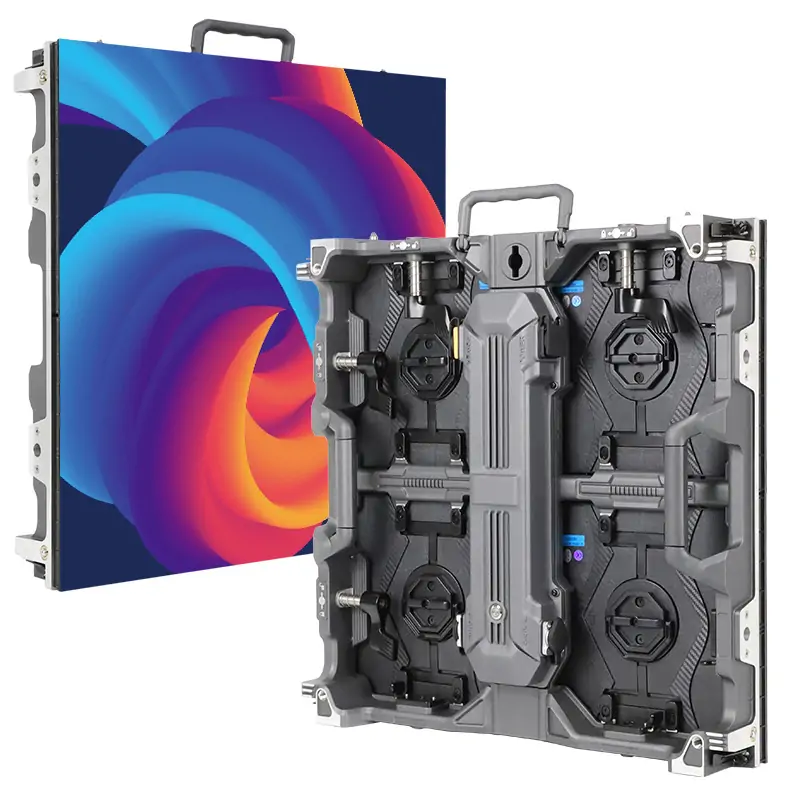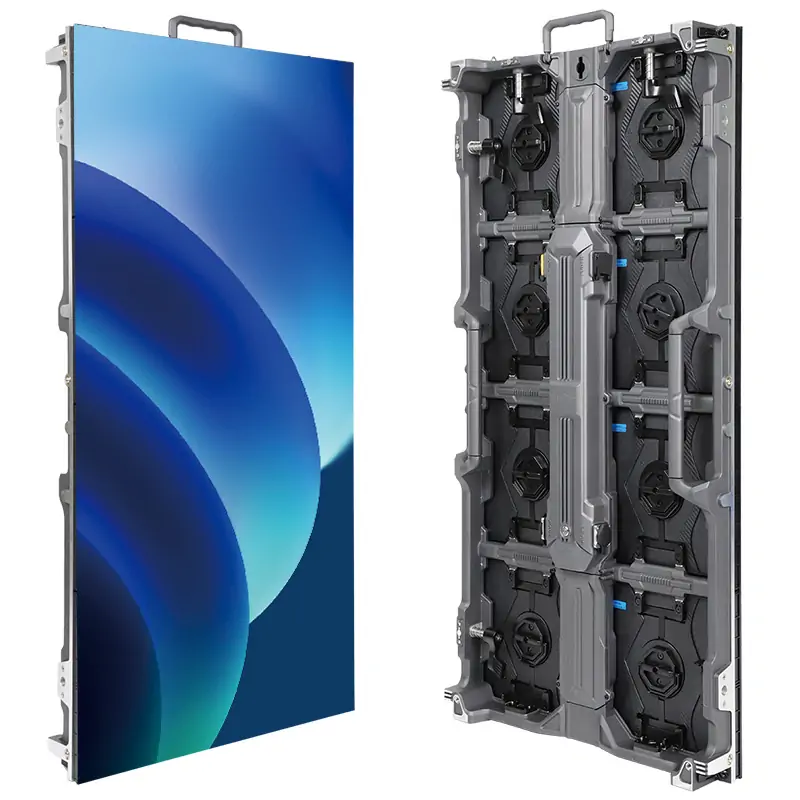
How much does a stadium screen cost? Any honest answer starts with a range, because a pitch-side perimeter band, an end-zone video board and a centre-hung arena display are three different products with three different cost structures. Across 2026 projects, stadium screen cost generally falls between US$400 and US$3,500 per square metre for the LED hardware alone, and between roughly US$25,000 and several million US dollars for a complete installed system. That spread is not arbitrary markup. It is the sum of eight drivers you can measure, quote and negotiate one at a time.
This guide separates those eight drivers, sets out the indicative bands buyers are seeing in 2026, and explains where an installed stadium screen budget actually goes. It is written for the people who have to defend the number: venue operators, club commercial managers, integration partners, and the engineers who will eventually sign off the steel and the power.
1. Short Answer: How Much Does a Stadium Screen Cost in 2026?
Stadium screen cost is quoted in three different ways, and most arguments about price come from comparing one with another: a rate per square metre for the LED panels, a price for the complete display package, and a price for the fully installed system including structure, power, control and commissioning.
Table 1 shows indicative 2026 bands. Treat them as screening ranges for early budgeting, not as a quotation. Every band assumes a reputable stadium-grade product with a credible warranty, and excludes structural steel, electrical infrastructure and installation unless stated.
| Screen type and position in the venue | Typical pixel pitch | Indicative LED hardware cost | Indicative installed cost |
|---|---|---|---|
| Outdoor perimeter LED (football pitch surround) | P6–P10 | US$400–1,100 per m² | US$700–1,900 per m² |
| Courtside ribbon and fascia LED | P4–P8 | US$700–1,600 per m² | US$1,200–2,600 per m² |
| End-zone video board (football, baseball, rugby) | P6–P10 | US$900–2,000 per m² | US$1,600–3,400 per m² |
| Indoor arena centre-hung or halo display | P4–P8 | US$1,100–2,500 per m² | US$2,000–4,500 per m² |
| High-resolution main video board (broadcast grade) | P2.5–P4 | US$1,800–3,500 per m² | US$3,000–6,000 per m² |
| Standalone scoreboard or auxiliary display | P8–P10 | US$2,000–12,000 per unit | US$6,000–25,000 per unit |
Two conclusions follow. First, area dominates everything: doubling screen area roughly doubles the panel cost before any discount, so the single most valuable cost decision is how large the screen genuinely needs to be. Second, the installed total is usually 1.5 to 2.5 times the panel price, and on structurally difficult venues it can be more.
If you are still deciding which type of screen the venue needs, the complete guide to stadium screens sets out the applications before the numbers. If the requirement has already moved outdoors, choosing an outdoor LED commercial screen covers the specification questions that follow.
2. The Eight Price Drivers That Decide Stadium Screen Cost
Before requesting a quotation, it helps to know how much of a typical stadium display budget each driver consumes. Table 2 is the summary used throughout this article, and sections 3 to 10 take each driver in turn.
| # | Price driver | What it covers | Typical share of installed budget |
|---|---|---|---|
| 1 | Screen area | Active LED area in square metres, cabinet count, spare modules | 30–45% |
| 2 | Pixel pitch and native resolution | LED density, driver ICs, receiving-card load, processing headroom | 10–20% |
| 3 | Screen type and venue position | Perimeter, ribbon, end-zone, centre-hung or halo; ingress protection and wind loading | 5–15% |
| 4 | Cabinet structure, steelwork and rigging | Ground frames, truss, wall reinforcement, hoists, catwalks | 8–15% |
| 5 | Power, electrical infrastructure and cooling | Distribution, protection, cabling, UPS, ventilation, thermal management | 5–12% |
| 6 | Control systems and signal processing | Video processor, sending cards, signal transport, redundancy, control room | 3–8% |
| 7 | Installation, commissioning and site conditions | Access equipment, labour, alignment, calibration, camera testing, work windows | 8–15% |
| 8 | Service, spares and long-term support | Spare parts, preventive maintenance, remote support, warranty travel | 5–12% |
The percentages overlap slightly because suppliers bundle work differently. Use them to sanity-check a proposal rather than to build a price from scratch. If a quotation puts 60% of the total into “installation and project management”, the scope needs to be itemised before it can be compared with anyone else’s.
Venue type also shapes which drivers move most. Sports LED displays and LED displays for sports venues follow the same cost logic, but a permanently installed club screen and a tournament rental system allocate their budget very differently.
3. Price Driver 1: Screen Area and Aspect Ratio
Area is the multiplier that sits in front of every other cost. Once pitch, cabinet grade and control are fixed, cost is close to linear in square metres. A 20% reduction in screen area typically removes close to 20% of the panel cost, and it also shrinks the structure, the power and the installation time that follow it.
3.1. How area becomes the largest single line item
Stadium screens are assembled from standard cabinets, and the cabinet count is what a supplier actually quotes. A 1,280 × 960 mm cabinet has a face area of about 1.23 m², so a 60 m² perimeter band needs roughly 49 cabinets before spares are added. Because cabinets come in fixed sizes, the usable screen area is often slightly smaller than the wall or frame you designed around. Always confirm the exact cabinet count and the final physical dimensions rather than the nominal target.
Area also sets the native resolution. A 60 m² screen at P8 is far cheaper to populate than the same 60 m² at P4, because the pixel count – and therefore the number of driver ICs, receiving cards and processor outputs – changes with the square of the pitch ratio. That interaction is the subject of the next section.
3.2. Why the rate per square metre falls as the screen grows
Suppliers rarely quote one flat rate. Larger projects spread fixed costs – engineering, tooling, programming, freight consolidation, commissioning – across more square metres, so the effective rate per m² normally drops as area increases. Two commercial consequences follow. A 10 m² order should not be expected to match a 100 m² rate, and a small phase-one screen bought at small-volume pricing can make a later expansion look artificially expensive.
3.3. Choose the smallest area that satisfies the sightline requirement
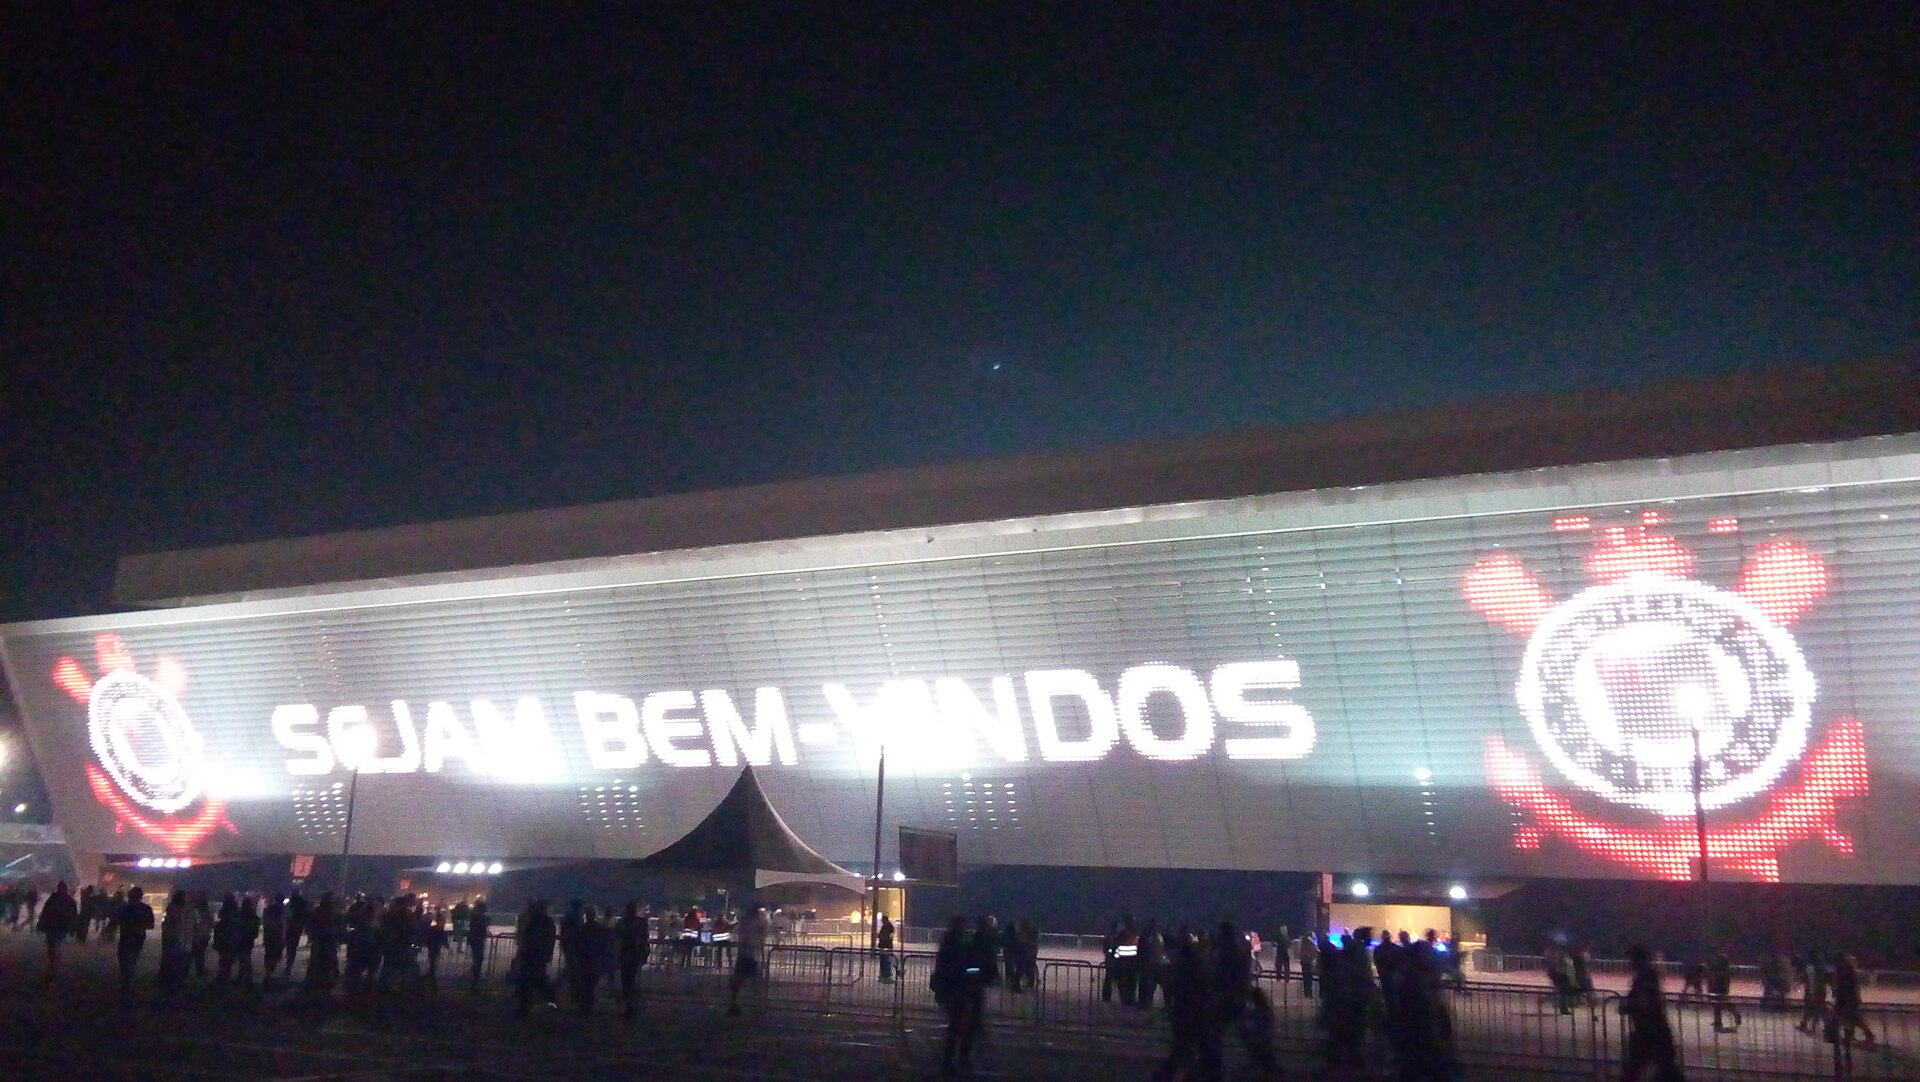
Area should be derived, not guessed. Set the required image height first: the smallest important content element – a sponsor logo, a score graphic, a replay caption, a clock – must be legible from the worst seat in the venue, not the best one. Width then follows from the aspect ratio the venue actually uses. Display sizing guidance such as the AVIXA standards programme defines display image size as the active area carrying content and relates readable element height to viewing conditions, which is a more useful starting point than a rule of thumb about seating capacity.
Two practical checks prevent an oversized order. First, compare the derived screen against the widest surface the venue can actually carry, including service tolerances. Second, test the smallest content at the derived height from the back row before the specification is frozen.
4. Price Driver 2: Pixel Pitch and Native Resolution
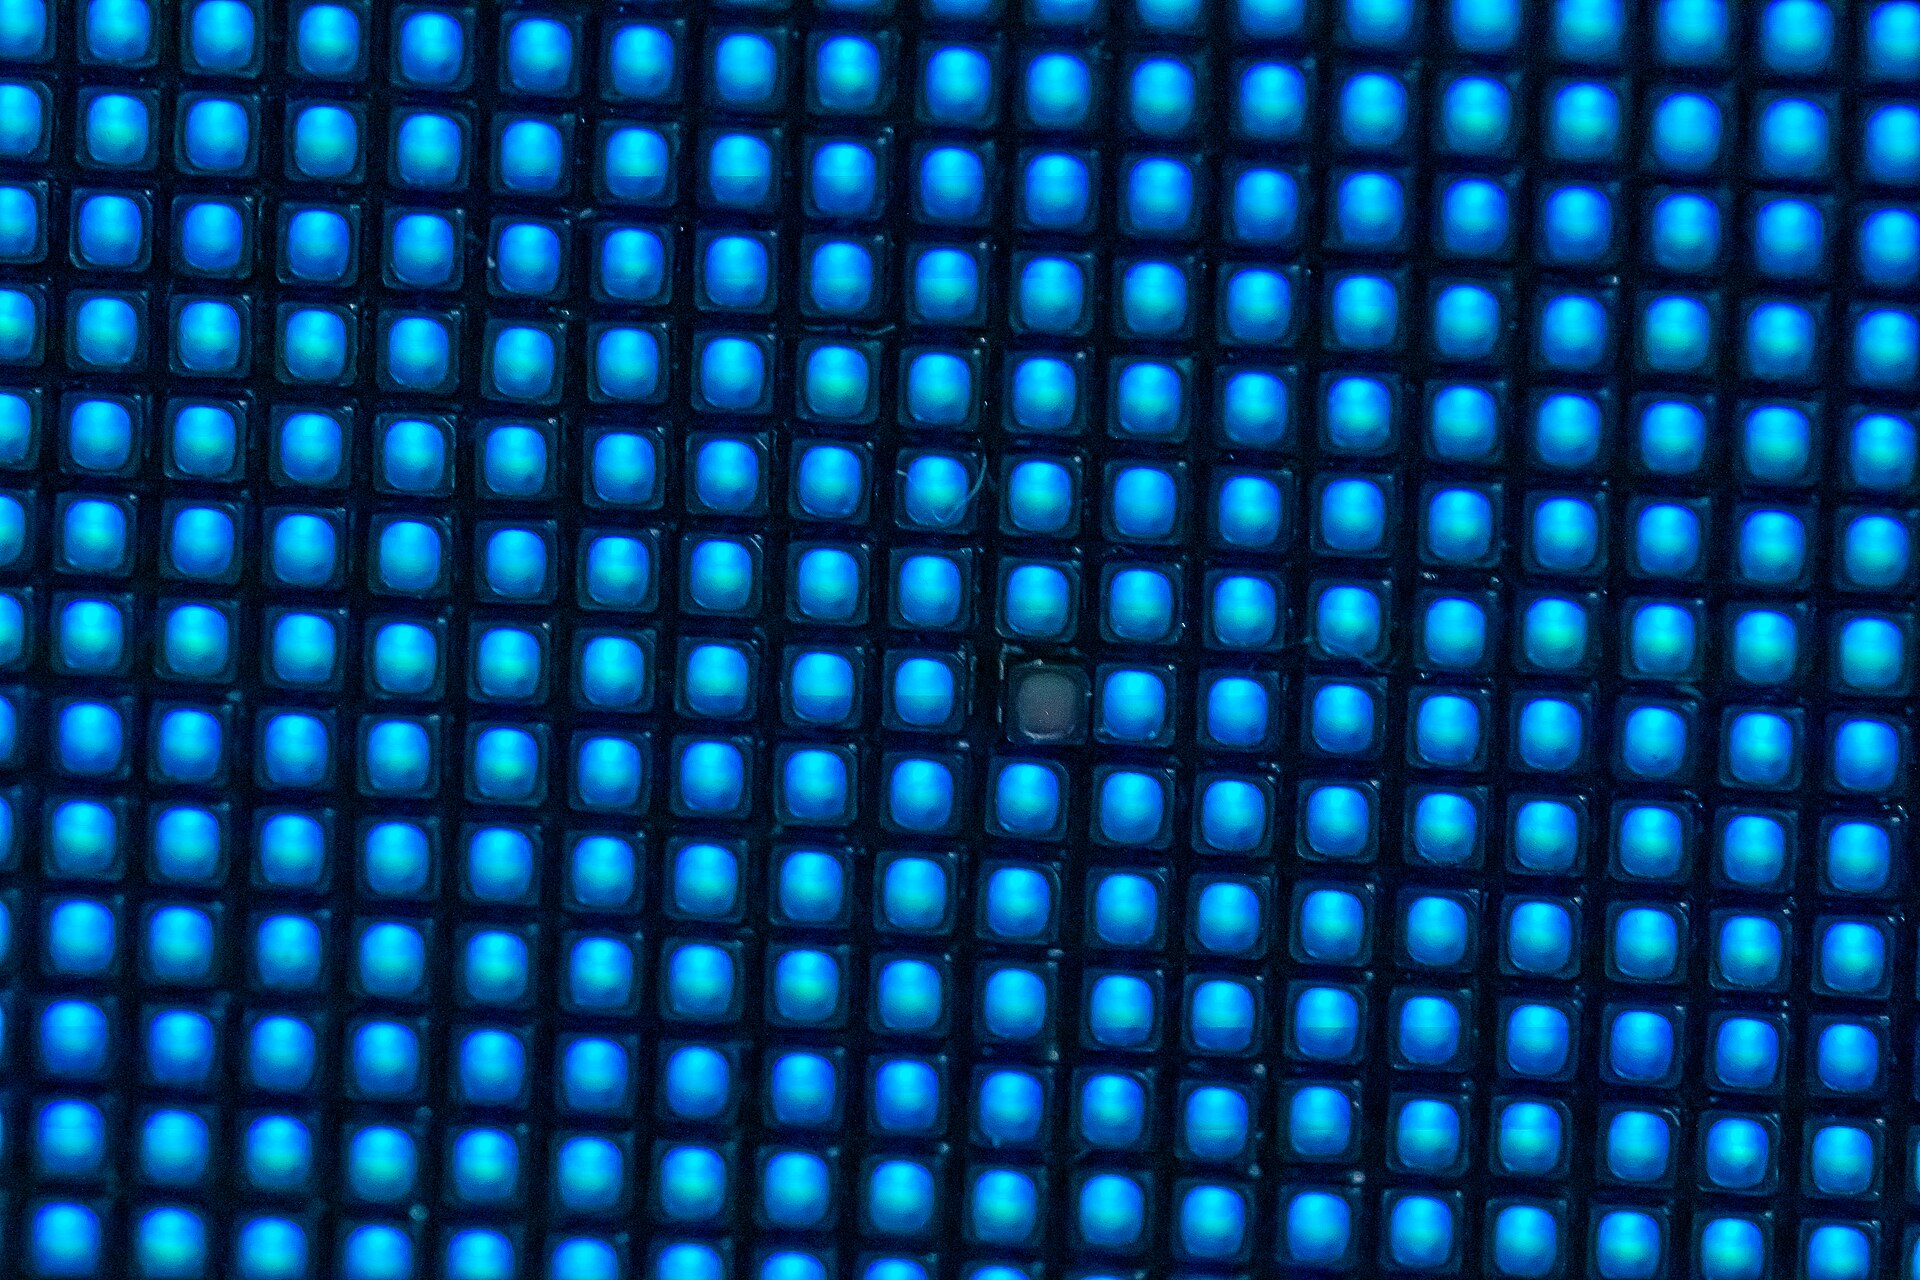
Pixel pitch is the centre-to-centre distance between adjacent LEDs, measured in millimetres. It is the second-largest cost driver and the one buyers most often over-specify, because “finer is better” feels like the safe choice. In a stadium it usually is not. A finer pitch raises panel cost, processor load and power, and above a certain density the extra pixels are invisible from every seat in the house.
4.1. What a finer pitch really adds to the invoice
Moving from P10 to P8 is not a 20% price increase. Pixel count per square metre rises with the square of the pitch ratio: (10 ÷ 8)² is about 1.56, so the same 60 m² screen carries roughly 56% more pixels and needs proportionally more driver circuitry, receiving-card channels, processing capacity and power. Moving from P10 to P6 nearly triples the pixel count for hardware that looks no better from the back of the stand.
4.2. Typical pitch bands for stadium applications
| Viewing context | Practical pitch band | Why this band usually wins |
|---|---|---|
| Pitch-side perimeter, nearest spectator 3–6 m | P6–P10 | Sponsor logos and simple graphics; finer pitch adds little at this distance |
| Courtside ribbon and fascia, 2–5 m | P4–P8 | Basketball and ice hockey venues often sit at the finer end |
| End-zone video board, nearest seat 20–40 m | P6–P10 | Replay, live video and statistics dominate; resolution matters more than pitch |
| Main broadcast video board appearing in camera shots | P2.5–P4 | Camera-facing boards need pitch and refresh-rate headroom |
| Centre-hung arena display, nearest seat 15–30 m | P4–P8 | Underside screens frequently use a finer pitch than the main faces |
The relationship between distance and pitch is a planning aid, not a rule. Visual acuity, content, brightness and camera position all change the answer, which is why the pixel pitch selection guide and the pixel pitch calculator should be used to build a shortlist and then confirmed on real panels with real content. Where the screen must also run native content without scaling, the LED screen resolution guide explains how pitch, cabinet count and source resolution interact.
5. Price Driver 3: Screen Type and Venue Position
Where a screen sits changes what it must survive. A perimeter band at pitch level absorbs impact, moisture and cleaning. A centre-hung board must be light, serviceable from a catwalk and engineered as a suspended load. A facade screen has to satisfy wind loading and local planning constraints. Those requirements are priced into the cabinet, the frame and the warranty, not into the brand.
5.1. Perimeter LED displays
Perimeter systems are the highest-volume stadium product and the most price-competitive, which makes them the easiest to compare and the easiest to buy badly. Service access is where the real difference lies. Front-service cabinets allow crews to replace a module from the pitch side without dismantling the frame, which matters when a match is 48 hours away and the screen sits against a barrier or an advertising board. Rear-service designs can be cheaper to buy and considerably more expensive to own in a venue with no rear corridor.
The EA1600SP stadium perimeter LED screen video shows the front and rear service design in practice, and the foldable corner design addresses the other perimeter cost that buyers forget: how quickly the system can be set up and struck around a pitch. For venues standardising on a single cabinet platform, the EA960SP4 stadium perimeter LED display is a useful reference point for how a specification sheet should look.
5.2. End-zone video boards and scoreboards
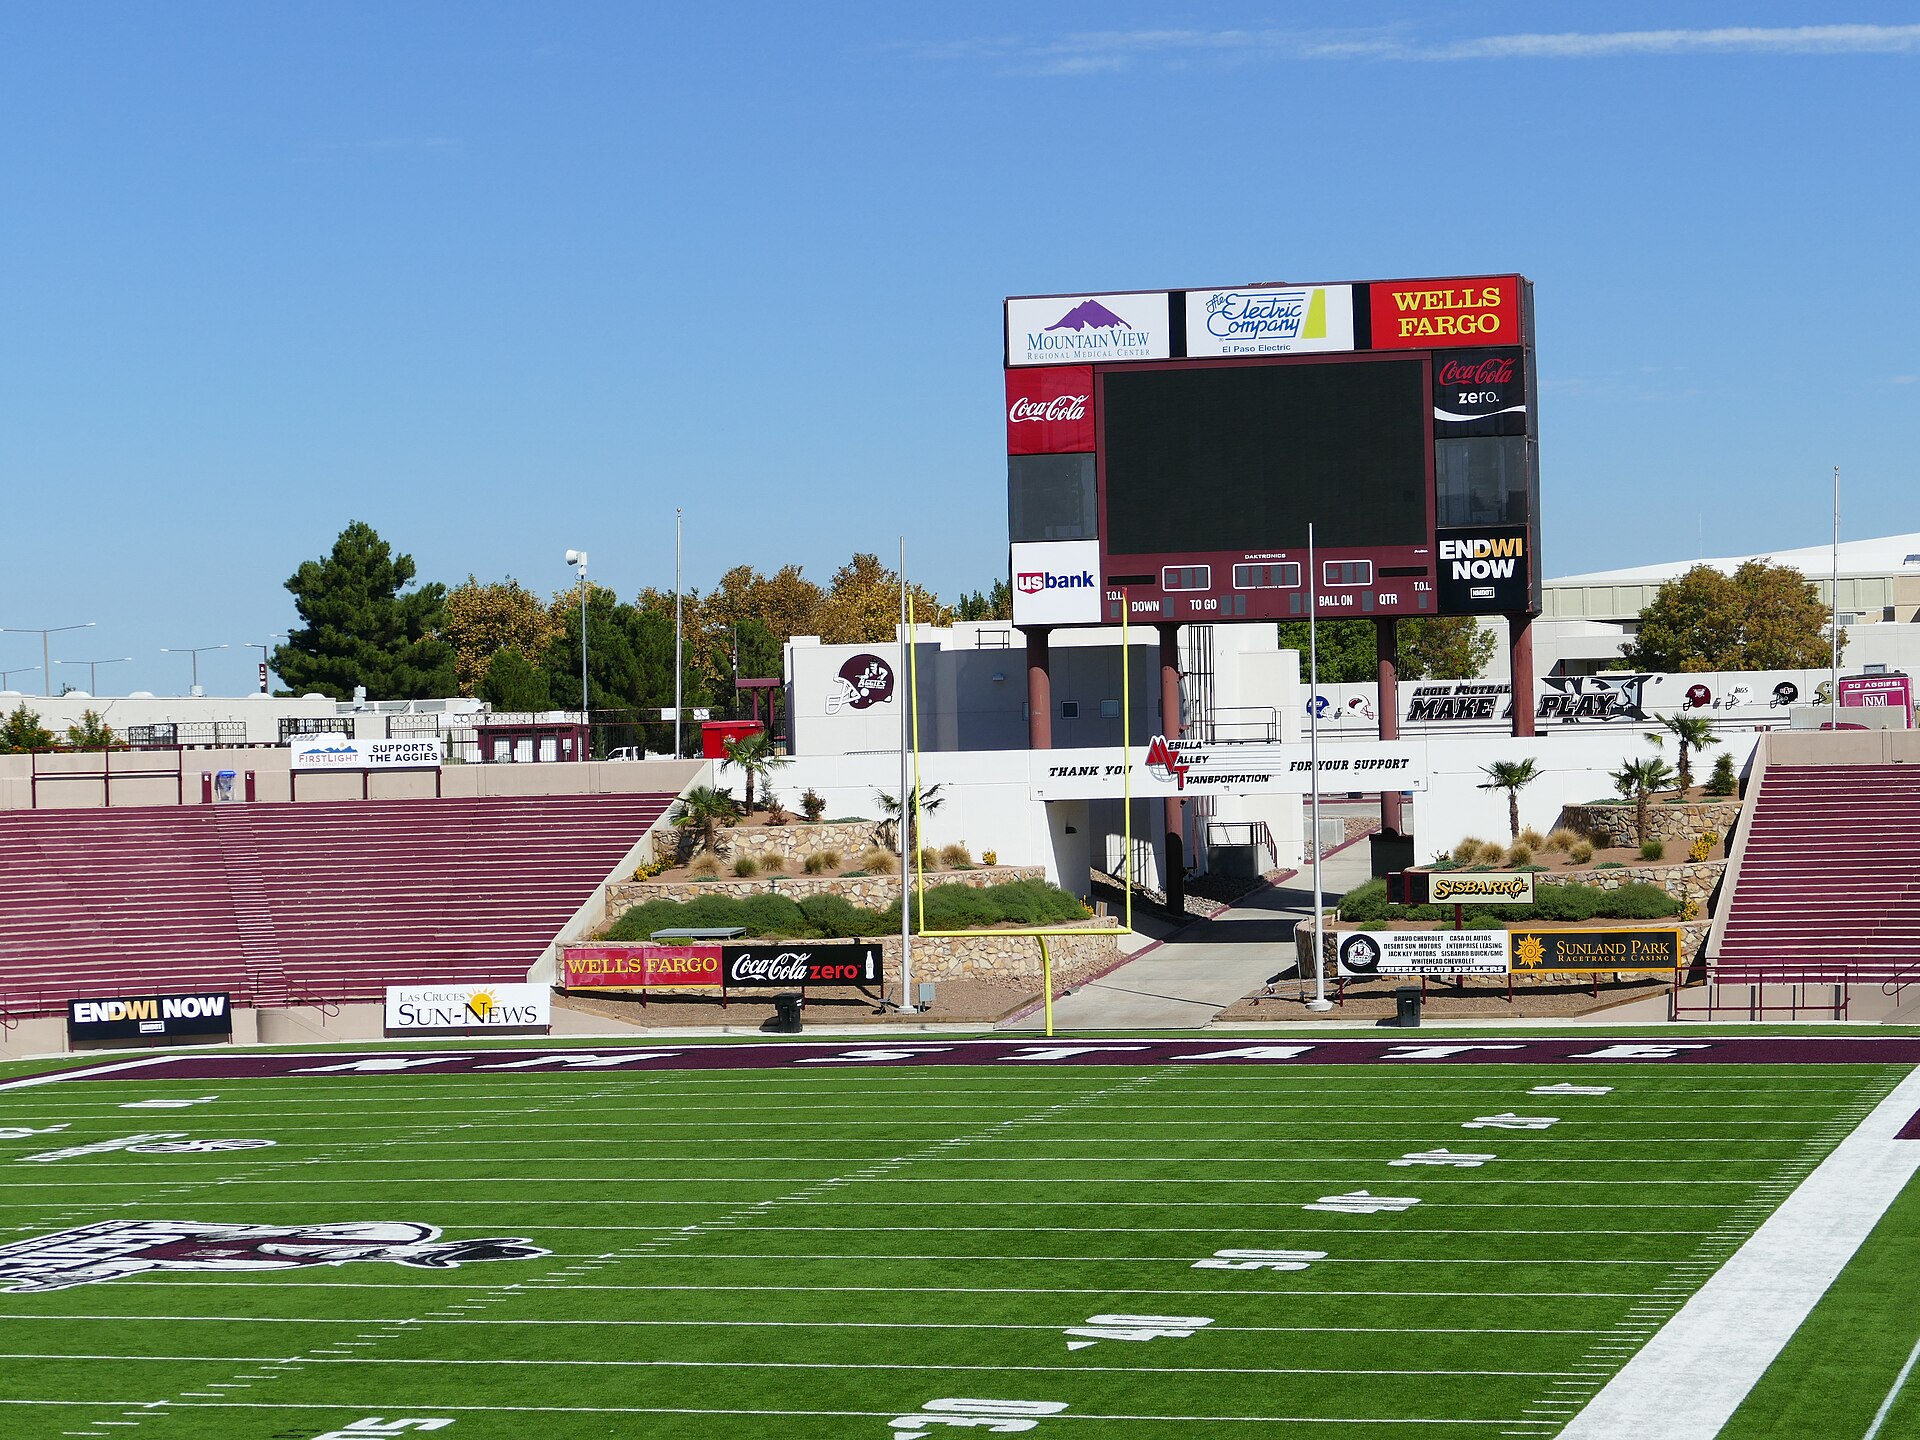
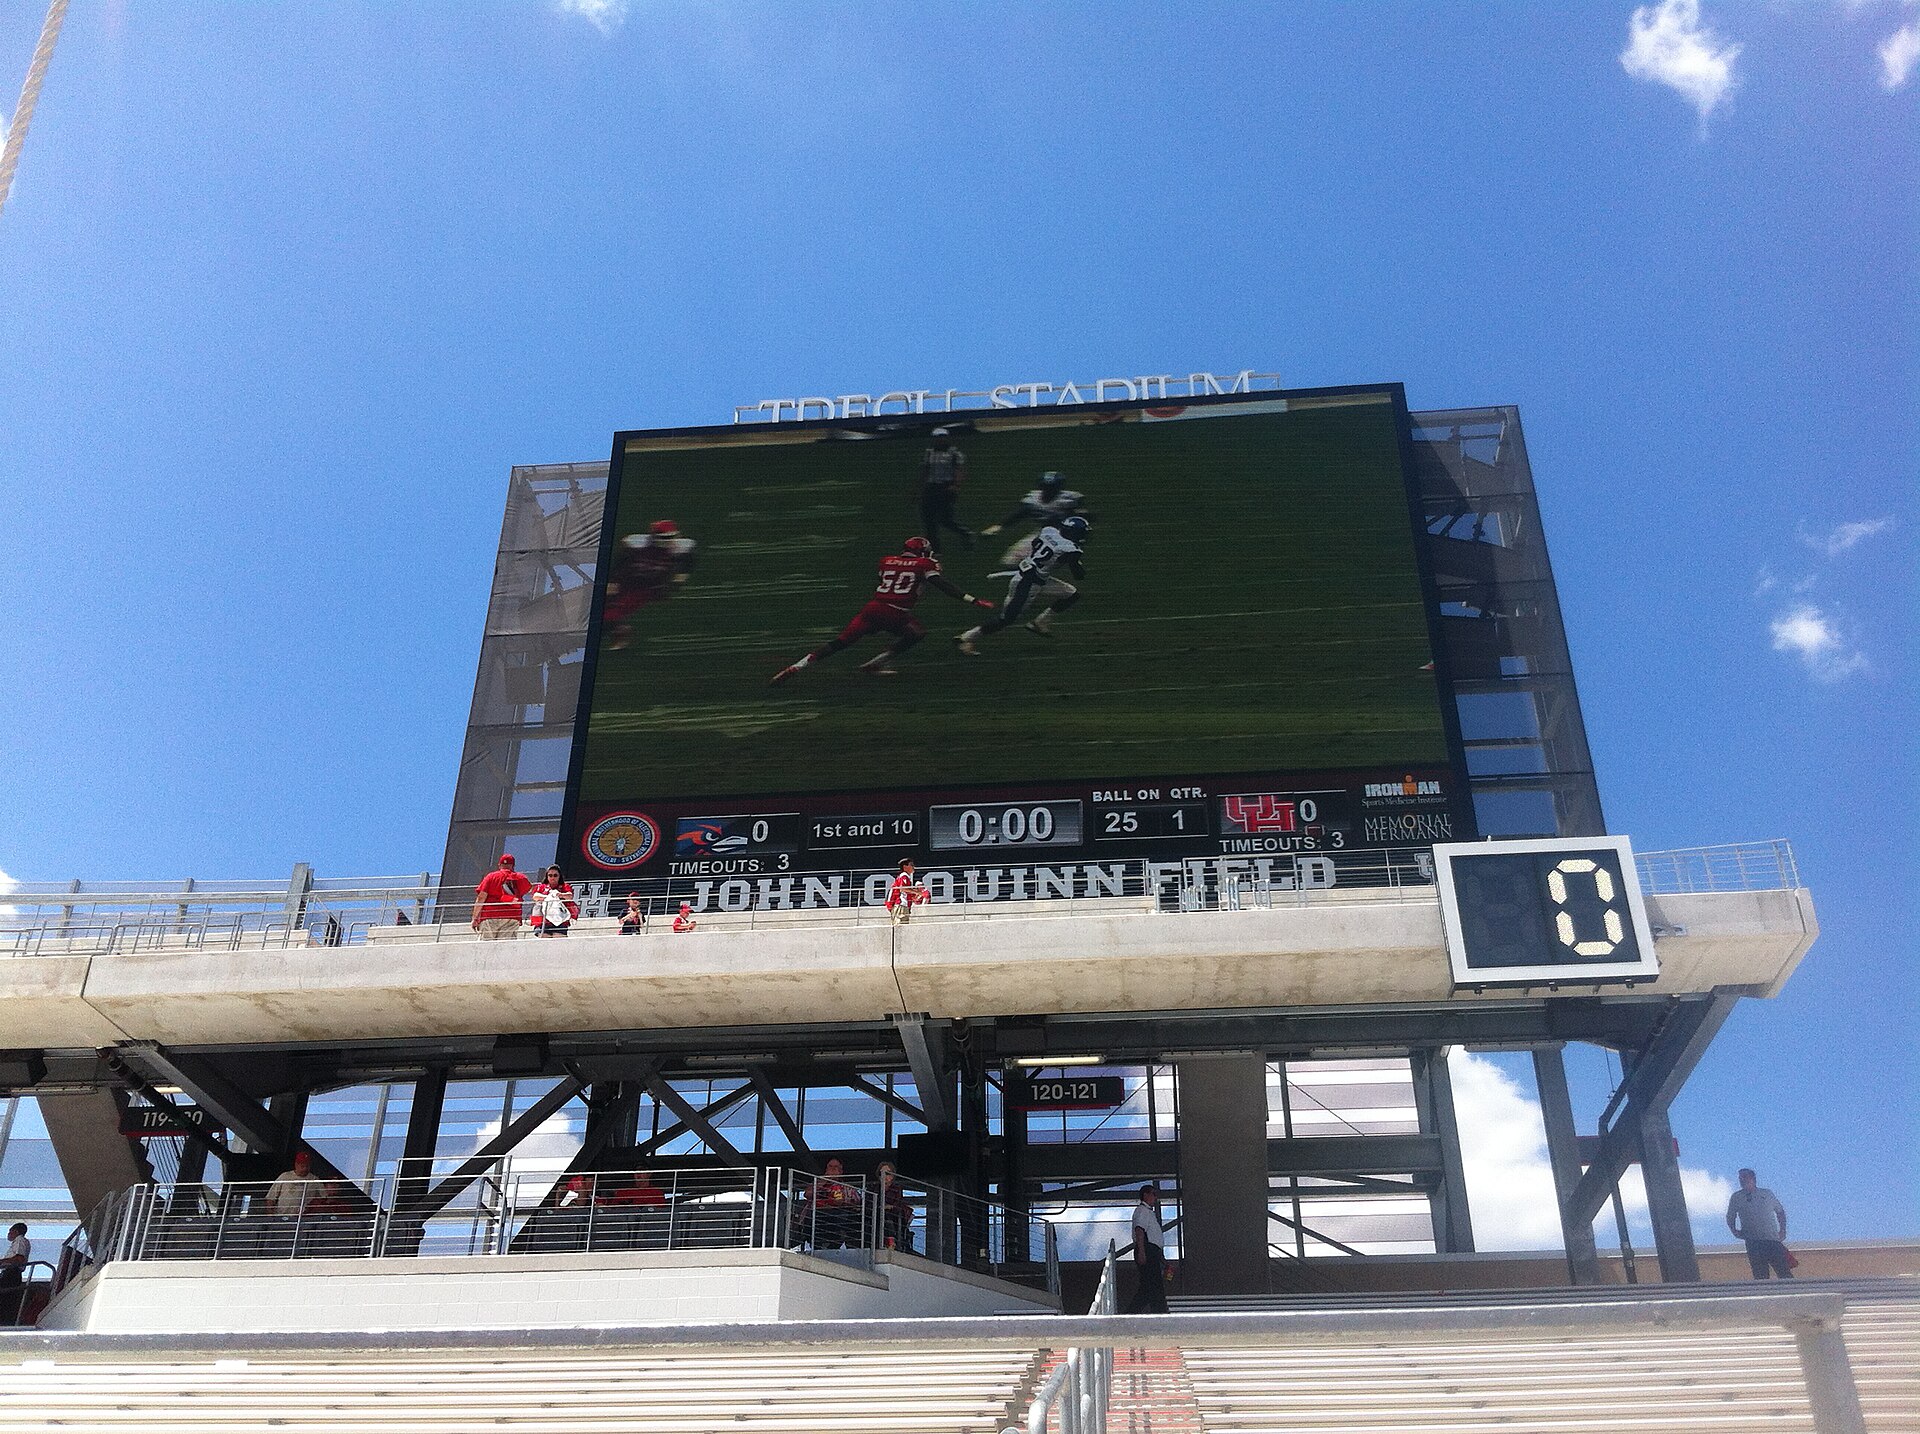
These are the screens spectators photograph, so they attract both the largest areas and the most demanding pitches. A single 120 m² end-zone board carries the pixel count of two or three perimeter systems, and because it is usually mounted on the stand structure or a tower, the structure and access costs scale with it.
5.3. Centre-hung and halo displays
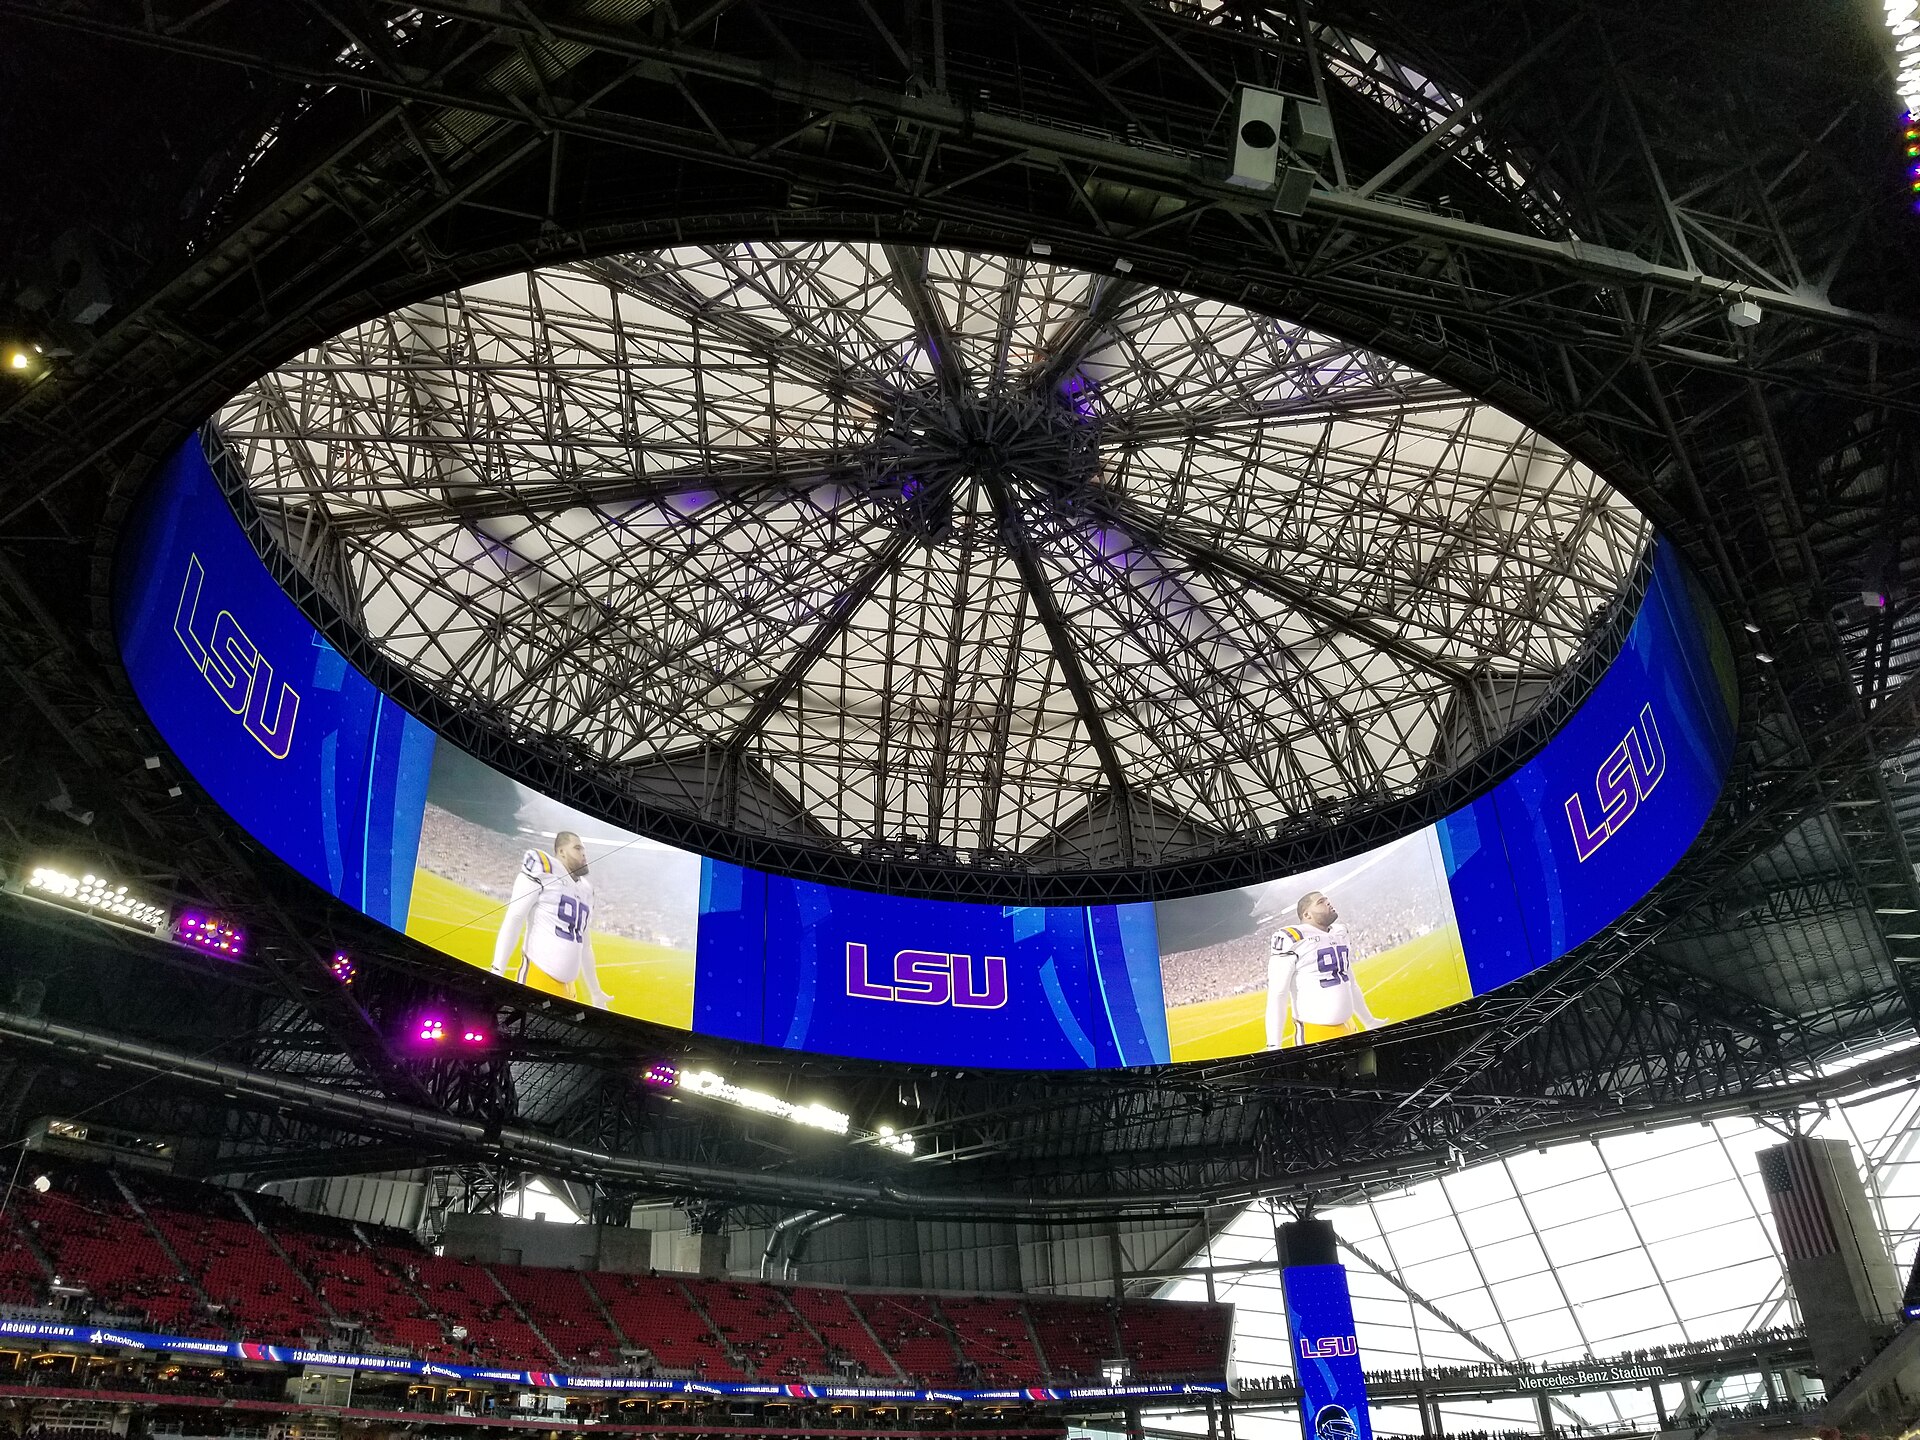
Centre-hung and halo displays are structural projects as much as display projects. A suspended ring or cube has to be carried by the roof, hoisted into position, and reached for service. Roof capacity, point loads, hoist redundancy, catwalk access and rigging time are frequently the majority of the contract value, which is why the same square metre of LED costs far more above a crowd than at pitch level. The EA960R1 arena LED screen installed in a Bahrain stadium is a useful reference for how an arena installation is scoped.
5.4. Ribbon, fascia and courtside displays
Ribbon and fascia displays run long distances at low height, so connector count, cable management, cabinet weight and maintenance access matter more than raw resolution. Because they are narrow, they are usually the cheapest screens in the venue per square metre – and the most expensive per running metre. Budget ribbon systems by length and joint count rather than by area, or the estimate will be wrong in the wrong direction.
6. Price Driver 4: Cabinet Structure, Steelwork and Rigging
This is where stadium budgets most often surprise the buyer. The LED panel is a mature, competitive product sold in a global market. The steel that holds it is a one-off engineering job, priced by a local fabricator, approved by a local structural engineer and installed on a site with its own access constraints and its own working hours.
| Structural option | Where it is used | What drives its cost |
|---|---|---|
| Ground-supported perimeter frame | Pitch-level perimeter and courtside ribbon | Frame length, wind and impact loading, ballast, folding design for storage |
| Wall-mounted frame and reinforcement | Facade and end-zone installations on existing buildings | Wall survey, anchor design, corrosion protection, planning conditions |
| Roof-suspended truss and hoists | Centre-hung cubes, halo rings, retractable boards | Roof capacity, point loads, hoist tonnage, catwalk access, redundancy |
| Freestanding steel tower | Standalone scoreboards in open stands | Tower height, foundation design, wind loading, lightning protection |
Frame decisions also change the operating cost, not only the capital cost. A folding or adjustable frame that travels and stores well removes labour hours from every event, even though the frame itself costs more than a fixed one. The adjustable rental LED display frame structure is a good illustration of that trade-off.
7. Price Driver 5: Power, Electrical Infrastructure and Cooling
LED screens are efficient per unit of light output, but they are still a large connected load concentrated in one place, and stadiums are usually constrained by existing switchgear rather than by cable. Expect the electrical scope to include a dedicated distribution board, surge and overcurrent protection, correct earthing, separation of power and data routes, and – for broadcast-critical or life-safety-facing screens – UPS coverage with a defined ride-through time.
Installations in most markets are governed by local electrical codes and standards. In North America, for example, NFPA codes and standards set out the requirements that a licensed electrical engineer will apply to the supply, protection and emergency provisions of a venue display.
7.1. Estimate the load before the electrician does
Manufacturers publish both maximum and average power, and the difference matters. Maximum power sizes the supply and the protection; average power, weighted by real content and real operating hours, sizes the energy budget. EagerLED’s guide to LED screen power consumption explains how to convert between the two, and the LED screen brightness guide explains why running a stadium screen well below its maximum brightness is usually the largest single energy saving available.
7.2. Cooling is the quiet cost
An outdoor cabinet on a 40 °C day with the sun on its face runs far hotter than the same cabinet in a shaded hall, and heat is what shortens the life of power supplies and driver ICs. Fan-cooled cabinets are cheaper to buy and more expensive to run and maintain; sealed passively cooled designs cost more upfront and less over five years. On a screen that must survive fifteen summers, that difference is worth modelling rather than assuming.
8. Price Driver 6: Control Systems and Signal Processing
A display is only as good as the signal reaching it. The control layer covers the video processor or scaler, the sending and receiving system, signal transport between the control room and the screen, and the operator interface used on match day. On a stadium project it is typically 3–8% of the installed budget, and it is the easiest place in the whole project to save money badly.
8.1. What the control layer has to deliver
Four requirements decide the cost of this layer, and each one should be stated explicitly in the specification:
- Inputs and zones. How many simultaneous sources must be shown, and how many independent screen zones must be driven from one canvas – the main board, a ribbon ring and an LED perimeter are often fed from a single processor.
- Redundancy. A backup processor, dual sending paths or a hot spare input card turns a single point of failure into a service note rather than a blackout during a televised fixture.
- Latency. Live camera magnification and referee review workflows have a much tighter latency budget than sponsor rotation, and processors are priced accordingly.
- Calibration and monitoring. Per-cabinet colour and brightness calibration, day and night brightness schedules, and health monitoring that reports a failing module before an operator notices it.
Those last features reduce service cost later, which is why specifying only pixel count at this layer is a false economy. A well-chosen processor also protects content legibility: strong foreground-to-background contrast is what makes text readable at distance, and the W3C contrast guidance offers a defensible benchmark for designing score graphics and sponsor layouts that survive a bright, low-contrast match-day screen.
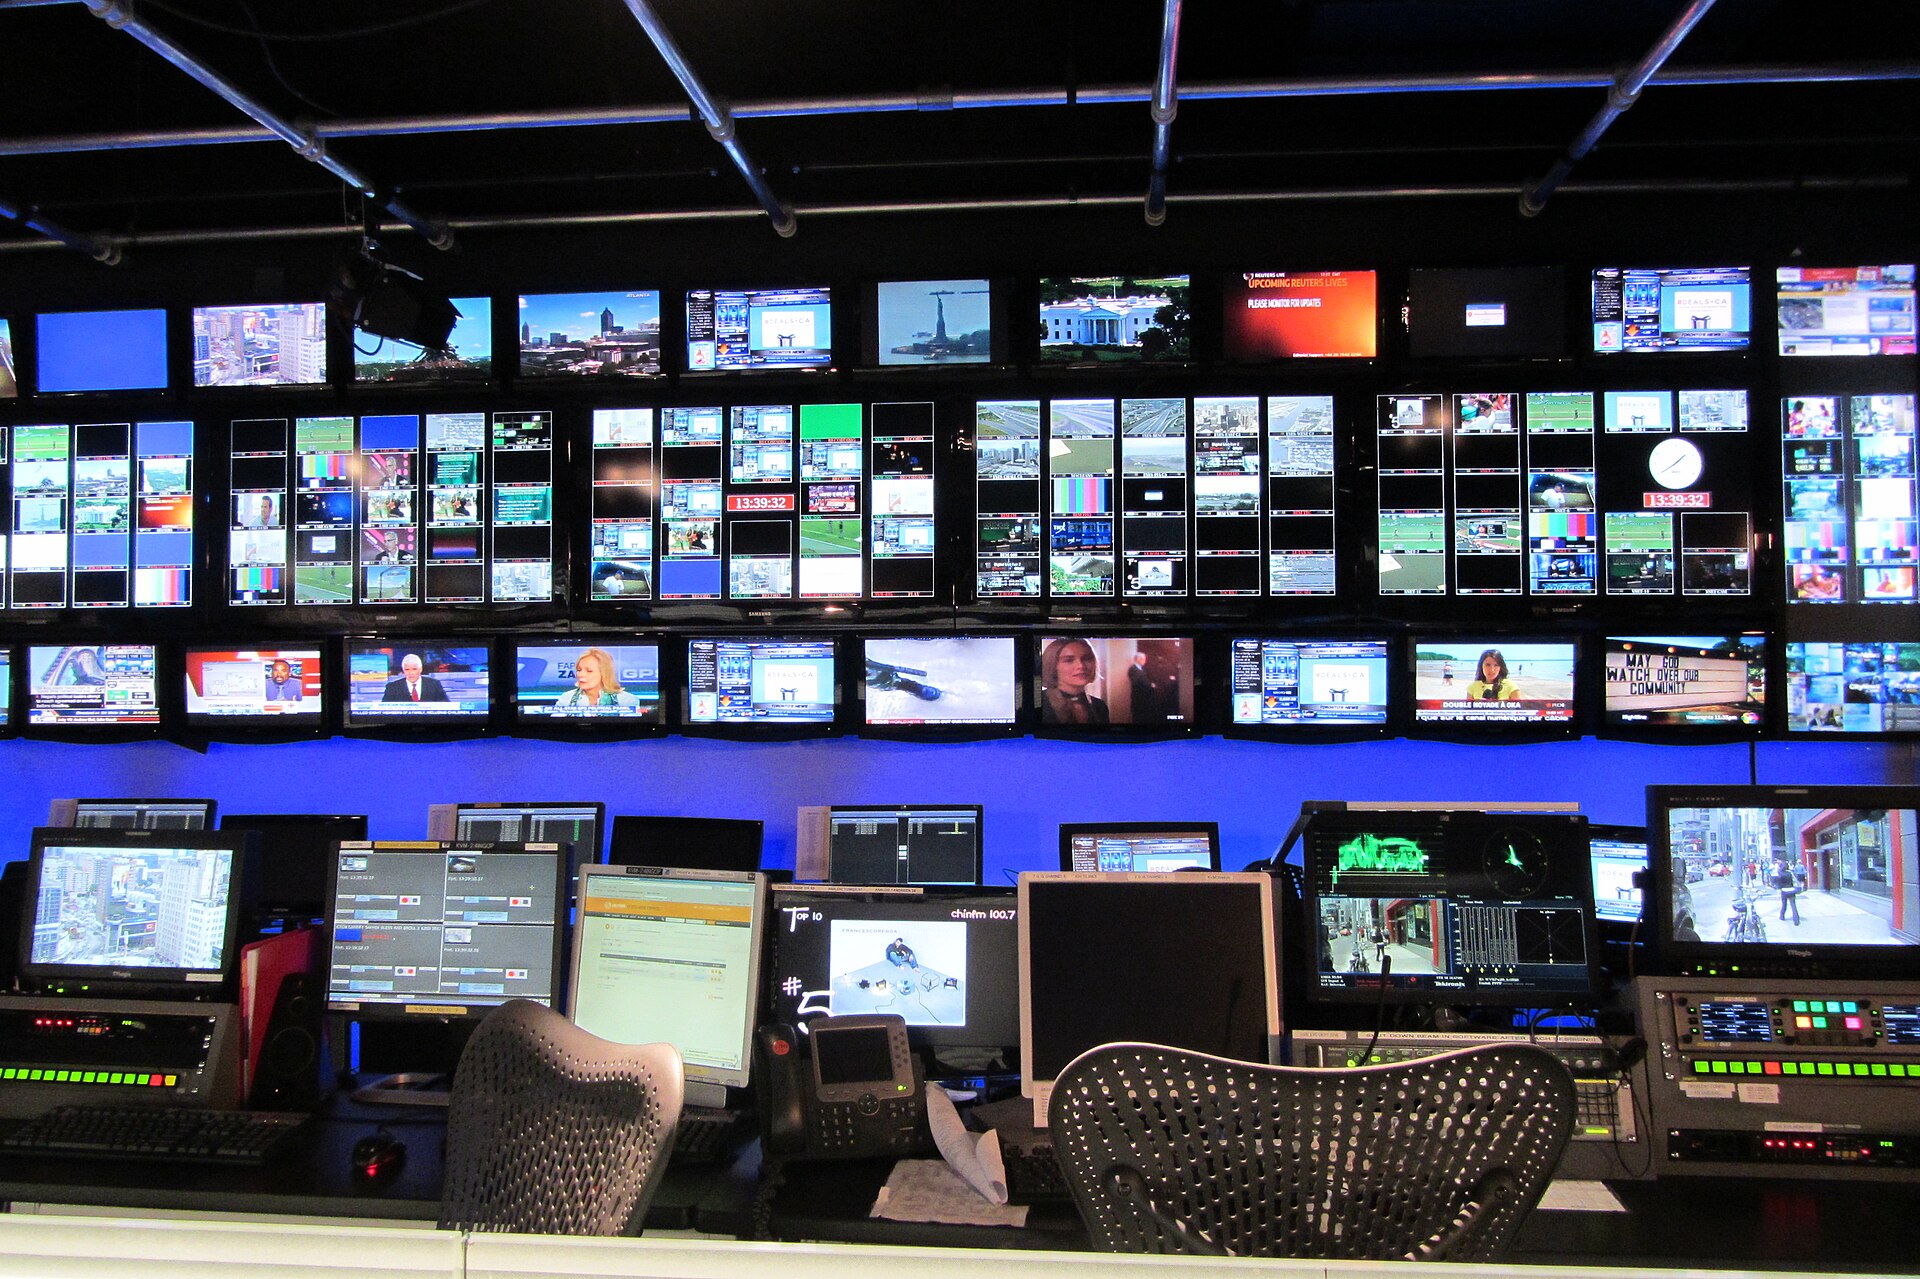
8.2. Camera performance is a control problem, not a panel problem
Refresh rate is a procurement filter, not a guarantee. Filming an LED screen requires the camera shutter and the LED refresh to be matched, which is why synchronisation features exist: Brompton Technology’s explanation of ShutterSync describes how matching shutter speed to the wall removes banding and lets the production team choose its camera configuration first. The practical lesson for a stadium budget is that camera testing belongs in the commissioning scope. If a broadcast partner will film the screen, the system must be proven with the real cameras, at the real frame rates and shutter angles, before final payment.
9. Price Driver 7: Installation, Commissioning and Site Conditions
Installation is the most site-specific cost in the project and the least suited to a rate per square metre. Two venues with identical screen specifications can differ by a factor of two on installation alone, because installation is priced on access, calendar and risk rather than on area.
| Installation cost factor | How it changes the price |
|---|---|
| Access equipment | Crane, hoist, mobile elevating work platform, roof access or scaffolding permits are priced per day and per lift |
| Venue availability | Work windows between fixtures, night shifts and event-day restrictions all carry a premium |
| Mounting height and complexity | Height, obstruction, tie-in to existing steel and the number of joints drive labour hours |
| Volume of cabinets and connectors | More cabinets means more joints, more alignment time and more calibration points |
| Commissioning depth | Alignment, colour and brightness calibration, camera testing and acceptance documentation |
| Local labour and travel | Local rates, travel, accommodation, insurance, site inductions and union agreements |
| Documentation and training | As-built drawings, configuration backups, operator training and handover |
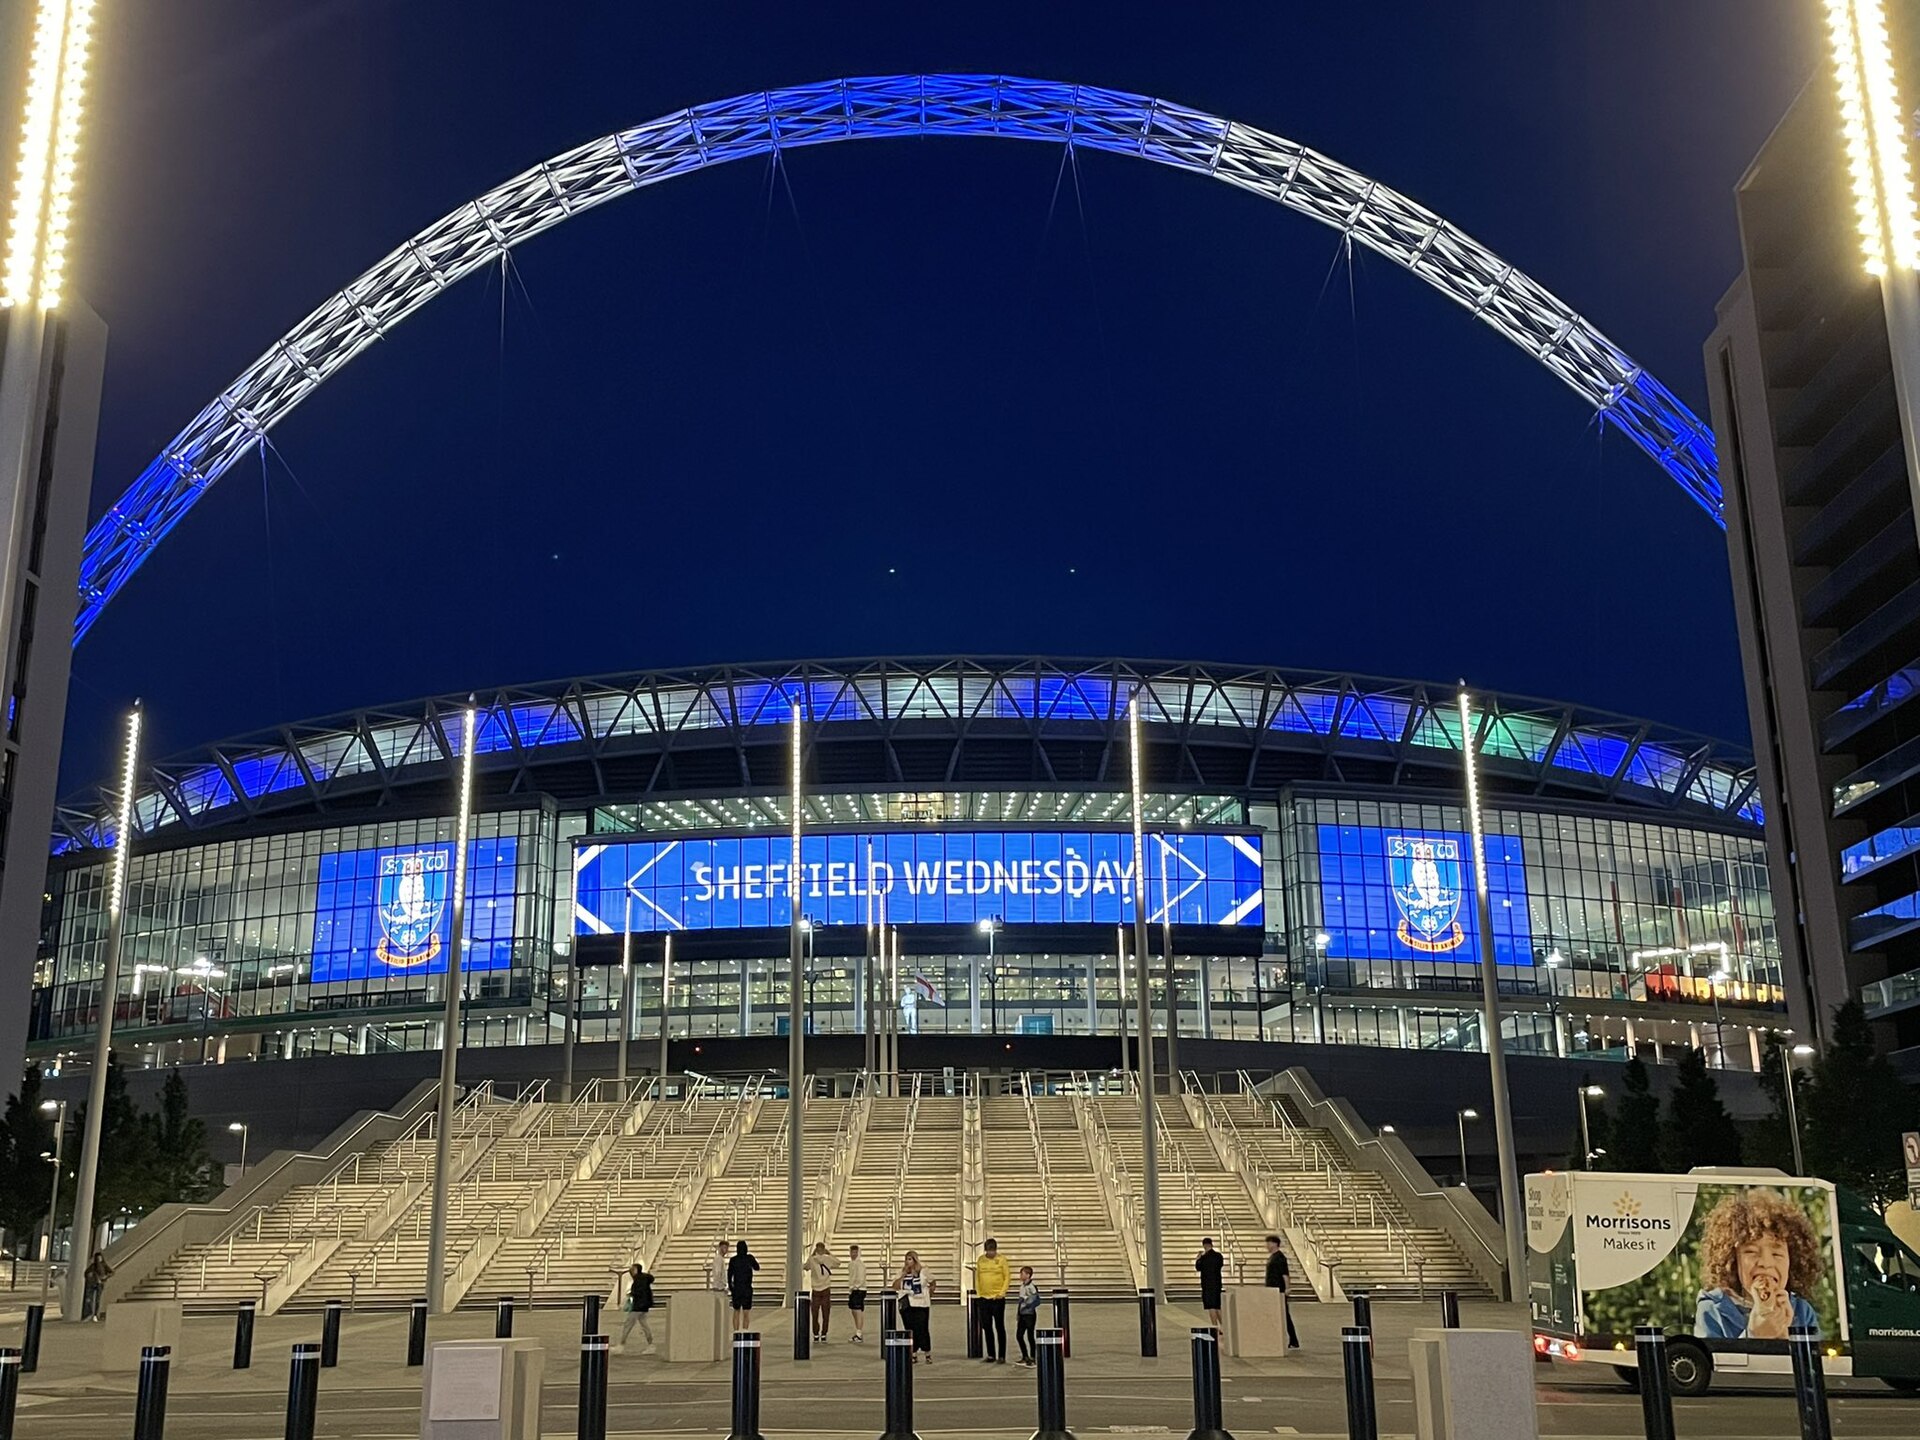
Plan for the calendar, not only for the equipment. A screen that is ready in March but can only be installed during a two-week international break carries an installation cost that reflects that window rather than the number of cabinets. Large venue rollouts are normally staged to match the fixture list, which is exactly how a multi-venue perimeter programme is delivered: panels are scheduled around the competition calendar rather than around factory output alone.
The record of 132 stadium perimeter LED displays shipped to Germany above shows the shape of that work: panels are built and pre-tested in the factory, shipped in event-sized batches, and commissioned against a fixed match calendar so that no venue is left without a screen on a match day.
10. Price Driver 8: Service, Spares and Long-Term Support
Service is the driver buyers most often omit at tender and then pay for repeatedly. A stadium screen runs for years in weather, at high brightness, in front of paying customers whose tolerance for a dead panel is low. The cost of keeping it perfect is a line item, and it should be in the original budget rather than in a later emergency.
| Service element | What to budget for |
|---|---|
| Spare parts | Modules (typically 3–5% of cabinet count), power supplies, receiving cards, cables, masks and spare tiles |
| Preventive maintenance | Scheduled inspection and cleaning, connector checks, seal and gasket inspection, fan or cooling service |
| Remote support | Diagnostics, firmware and configuration management, and a documented escalation path |
| Response commitments | Whether the venue is served from local stock or from the factory, and the travel cost attached to each visit |
| Recalibration | Colour and brightness recalibration after module replacement, so repaired cabinets match their neighbours |
A warranty statement is not a service plan. A three-year warranty that covers parts but not labour, travel or access equipment can cost a venue more over its life than a shorter warranty attached to a genuine support contract. The question to ask is concrete: if a cabinet fails on the morning of a match, who answers, how quickly, with what stock, and at whose cost? Training venue staff changes this arithmetic significantly, which is why training technicians to repair and diagnose LED modules is often the cheapest service provision available.
11. Five-Year Total Cost of Ownership for a Stadium Screen
Purchase price is the first part of the story, not the whole of it. Table 6 models five-year total cost of ownership for the illustrative 60 m² P8 perimeter system used throughout this article. The figures are indicative, exclude tax, and should be replaced with quoted numbers for a real project.
| Five-year cost element | Basis | Five-year total |
|---|---|---|
| Display hardware and installation (one-off) | 60 m² at an indicative installed rate of about US$1,275 per m² | US$76,500 |
| Preventive maintenance and remote support | About US$1,200 per year | US$4,800 |
| Spare parts replenishment | About 3% of hardware value per year, years 2–5 | US$5,040 |
| Energy | Approximately 7.2 kW average, 500 operating hours per year at US$0.15 per kWh | US$2,160 |
| Insurance and asset management uplift | About US$400 per year, years 2–5 | US$1,600 |
| Mid-life recalibration and refurbishment | Full calibration and replacement modules in year 4 | US$3,500 |
| Indicative five-year total | Purchase plus four years of ownership | ≈ US$93,600 |
That is roughly 22% on top of the purchase price over five years, which is a useful rule of thumb when comparing a low purchase price against a lower running cost. Note also which line is smallest. Energy is the least significant element for a typical stadium screen; the money follows spare parts, service visits and refurbishment. A cheaper cabinet with expensive consumables is rarely the cheaper asset, and the same logic applies across display formats, as the cost analysis in the 3D billboard cost guide and the outdoor screen cost guide also show.
12. How to Budget and Reduce Stadium Screen Cost Without Cutting Corners
Build the budget in the order the costs are actually incurred, and put a named owner against every line. Table 7 is a worked example for the 60 m² P8 perimeter system, and it is deliberately structured so that a supplier quotation can be dropped into it line by line.
| Budget line (60 m² P8 perimeter example) | Indicative cost |
|---|---|
| LED cabinets and modules, P8, 60 m² | US$42,000 |
| Spare modules, power supplies and receiving cards | US$1,700 |
| Video processing, sending and receiving system, cabling | US$6,500 |
| Ground support frames, brackets and ballast | US$9,000 |
| Power distribution, protection, earthing and UPS | US$4,500 |
| Freight, duties and insurance | US$3,800 |
| Installation, alignment and commissioning | US$7,500 |
| Training, documentation and first-year support | US$1,500 |
| Indicative installed total | ≈ US$76,500 |
Once the budget is visible line by line, cost reduction becomes an engineering conversation rather than a negotiation. Table 8 lists the levers that genuinely work and the conditions that make each one safe.
| Cost lever | Typical saving | How to apply it safely |
|---|---|---|
| Use the coarsest pitch that still passes the worst-seat test | 15–30% of cabinet cost | Test the worst seat and the broadcast camera, not the front row |
| Reduce screen area to the derived requirement | Proportional to area removed | Re-derive image height from the smallest important content element |
| Reuse existing structure or wall reinforcement | 5–15% of project | Structural engineer confirms capacity and anchor design in writing |
| Tender equal-scope packages to three suppliers | 5–15% of project | Issue one specification with identical spares, service and commissioning terms |
| Buy spare parts with the first order | 10–20% of future parts cost | Match the module batch and driver IC revision to the installed cabinets |
| Phase the rollout across budgets | 30–50% of upfront cash | Size power, structure and processing for the final phase from day one |
| Choose a serviceable design over a novel one | Reduces five-year cost | Prefer front service, standard cabinet sizes and locally available spares |
Two savings are almost always false economies. Removing spares leaves the venue waiting weeks for a shipment the first time a cabinet is damaged. Removing commissioning leaves a screen that has never been colour matched, and an uncalibrated screen looks worse than a screen one step coarser that was set up properly. If the budget must be cut further, cut area or pitch – not the work that makes the screen reliable.
13. Stadium Screen Cost FAQs
14. Conclusion
Stadium screen cost is not a single number, and any supplier who offers one without asking about viewing distance, structure and service access is guessing. Break the project into its eight drivers – area, pixel pitch, screen type, structure, power, control, installation and service – and price each one with a named owner.
Get two decisions right and the rest follows. Choose the smallest screen area that makes the most important content legible from the worst seat, and choose the coarsest pixel pitch that still passes that test on camera. Those two choices normally move the final number more than every negotiation that follows them.
Then verify the whole system once, on site, with real content: alignment, colour, brightness, camera performance, spares, documentation and training. A stadium screen that is delivered, calibrated and serviceable will still be earning its place in ten years. A cheaper screen that nobody can maintain will be replaced long before that.
If you would rather have a costed opinion than a list price, send EagerLED your screen dimensions, viewing distances and venue constraints through the contact page, and we will come back with an itemised budget instead of a single figure.
 NovaStar ViPlex Express: Download, Setup & Troubleshooting
 EagerLED Mid-Autumn Festival 2026 & Holiday Notice
Related Posts

Fill In Your Needs In Detail
Fill in the screen usage scene and size you need in “Content”.You will get a quote.