LED screen power consumption is not one fixed number. The maximum wattage on a specification sheet describes a worst-case electrical load, while the average operating wattage determines most of the electricity bill. For a useful estimate, multiply screen area by realistic average watts per square meter, convert watts to kilowatts, and then multiply by operating hours and the local electricity tariff.
This guide explains that calculation from the cabinet level to annual operating cost. It also shows why brightness, content, pixel pitch, power-supply efficiency, cooling, and operating schedules can change the result. Use the examples for budgeting, but use the proposed display’s verified data sheet and on-site measurements for final electrical design.
1. How Much Power Does an LED Screen Use?
A direct-view LED screen commonly draws a few hundred watts per square meter during normal operation, but the usable figure varies widely. A fine-pitch indoor wall operated at moderate brightness may consume less than a high-brightness outdoor billboard, while a transparent display can have a different load profile because less of its surface contains emitting pixels.
Do not quote one universal W/m² number. Ask for both maximum power and typical or average operating power for the exact cabinet, pixel pitch, brightness setting, scan configuration, and mains voltage. Then identify the purpose of the calculation:
- Electrical infrastructure: use the manufacturer’s maximum connected load and follow local code.
- Electricity budget: use a defensible average operating load based on realistic content and brightness.
- Energy optimization: measure the complete installed system over representative operating periods.
This distinction is the most important point in any LED display energy calculation. A screen displaying full white at 100% brightness can approach its maximum rating; mixed video at calibrated brightness usually does not.
2. Understand Watts, Kilowatts, and Kilowatt-Hours
Power and energy are related but not interchangeable. The U.S. Energy Information Administration’s electricity measurement guide explains that watts measure the rate of electricity use, while watt-hours measure the energy used over time.
2.1. Watts and watts per square meter
Watts (W) describe instantaneous real power. LED display manufacturers often state power density in watts per square meter (W/m²), which allows screens of different sizes to be compared. Multiply W/m² by active screen area to estimate total display power.
2.2. Kilowatts and kilowatt-hours
One kilowatt equals 1,000 watts. A kilowatt-hour (kWh) is the energy used by one kilowatt operating for one hour. Electricity tariffs are normally expressed as currency per kWh, so an LED screen’s wattage must be converted to kW before calculating cost.
Energy (kWh) = Power (kW) x Operating time (hours)
2.3. Maximum, average, black-screen, and standby power
Maximum power is normally associated with a full-white test image at the highest output. Average power represents changing content and a realistic brightness level. On a black image, the LEDs emit little or no light, but receiving cards, driver circuitry, power supplies, processors, and fans can remain energized. Standby also consumes power unless the relevant equipment is physically isolated.
3. How to Calculate LED Screen Power Consumption
The most reliable early-stage calculation starts with the manufacturer’s W/m² rating. Pixel-level formulas using diode current, voltage, scan rate, and pixel density are useful to display engineers, but they are easy to misuse because the complete cabinet also includes driver losses, control electronics, power supplies, and auxiliary loads.
3.1. Calculate active screen area
Screen area (m²) = Width (m) x Height (m)
Use the actual active display dimensions, not the overall frame or supporting structure. For irregular canvases, divide the display into rectangles and add their areas. The EagerLED LED display size guide explains how cabinet increments affect the final dimensions.
3.2. Calculate maximum and average screen power
Maximum screen power (kW) = Area (m²) x Maximum W/m² / 1,000
Average screen power (kW) = Area (m²) x Average W/m² / 1,000
If a supplier provides only maximum power, do not silently assume that average power is exactly one-third or one-half of it. Ask for a typical value and its test conditions. If an early budget must proceed without that value, state the assumed load factor and run a sensitivity range rather than presenting one precise answer.
3.3. Add processors, control equipment, and cooling
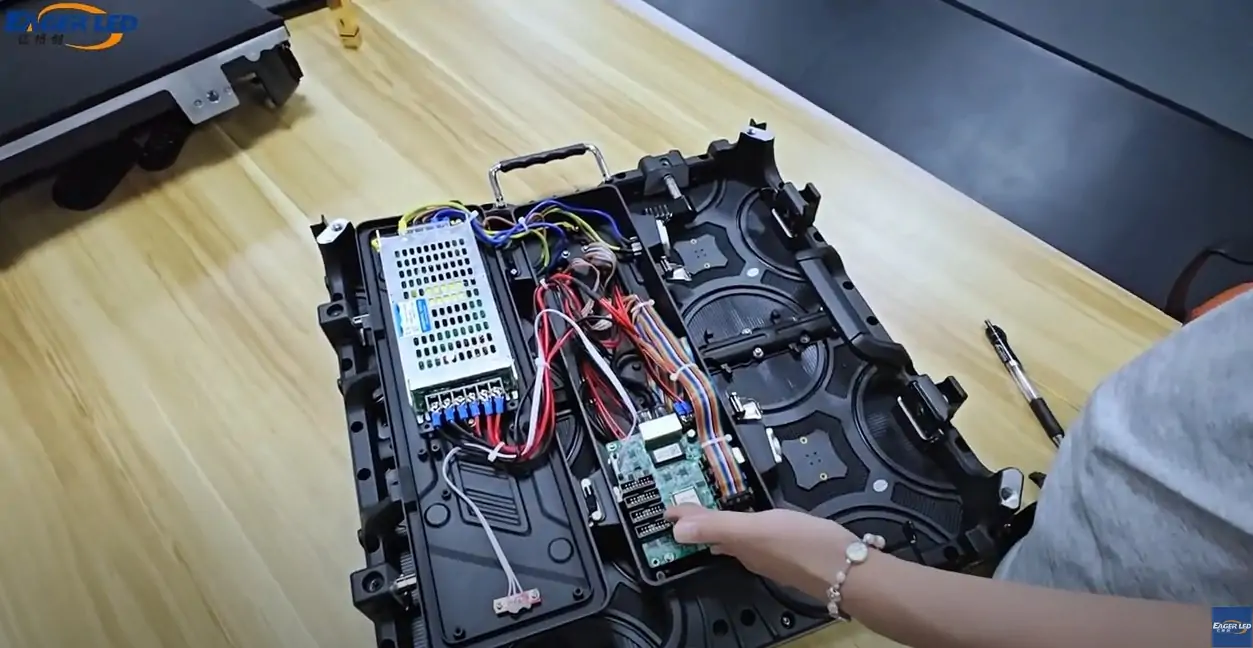
A complete system estimate should include video processors, sending devices, network equipment, cooling fans, cabinet heaters where used, and room air-conditioning attributable to the display. List each auxiliary load separately. A percentage allowance is acceptable for concept budgeting, but final design should use the actual equipment schedule.
4. How to Calculate LED Screen Electricity Cost
Once average system power is known, the operating-cost calculation is straightforward:
Daily energy (kWh) = Average system power (kW) x Hours per day
Monthly cost = Daily energy x Operating days per month x Tariff per kWh
Annual cost = Daily energy x Operating days per year x Tariff per kWh
Use the effective tariff from the relevant electricity bill. Commercial users may also face demand charges, time-of-use pricing, taxes, or tiered rates, so a simple kWh calculation may not reproduce the entire bill. The U.S. Department of Energy’s energy-use estimation method follows the same wattage-times-hours principle.
For procurement, calculate at least three scenarios: low-content/low-brightness, expected operation, and a high-load case. This range is more useful than a single number that implies false precision.
5. Typical LED Screen Power Consumption per Square Meter
The ranges below are planning references, not product guarantees. Actual values depend on LEDs, driver architecture, scan mode, cabinet thermal design, calibrated brightness, and content. Replace them with verified data for the proposed screen.
| Application | Indicative average range | Main reason for variation |
|---|---|---|
| Indoor fine-pitch LED wall | About 150-350 W/m² | Pixel density, scan mode, brightness, low-gray performance |
| Indoor rental or retail display | About 180-350 W/m² | Pitch, operating brightness, content APL |
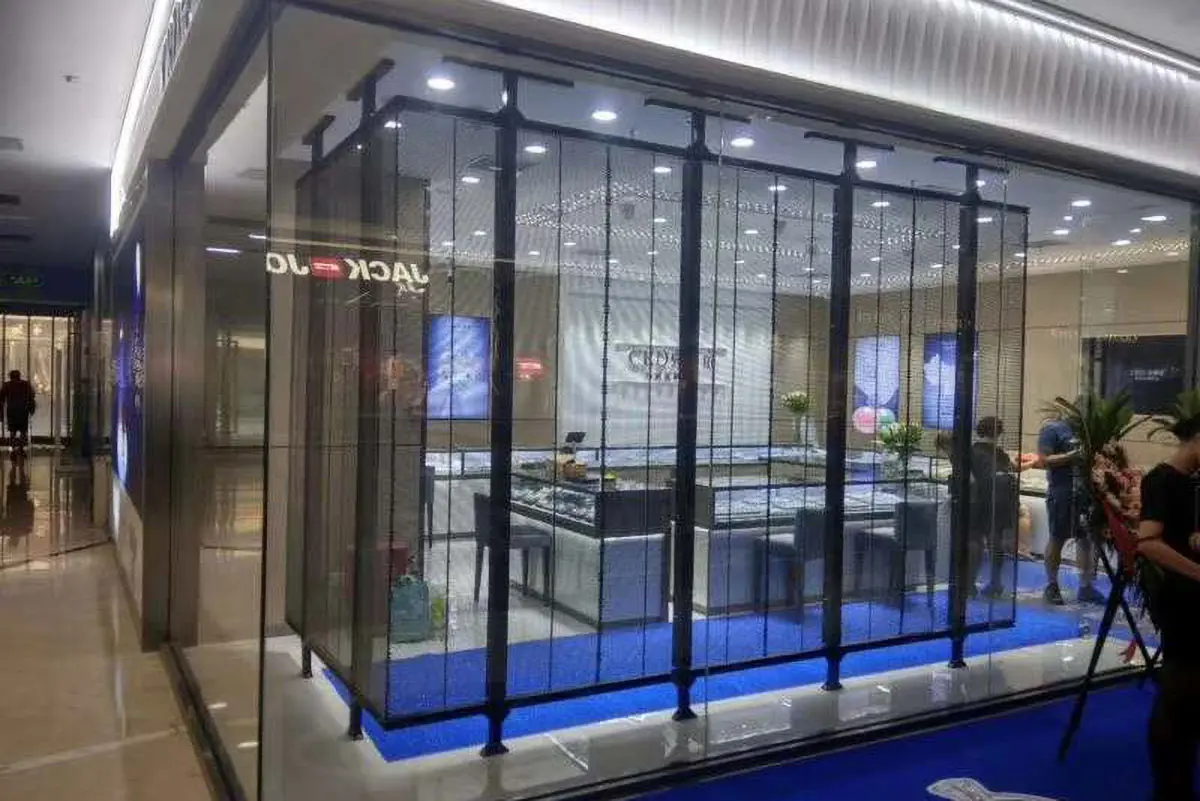
| Transparent LED screen | About 150-450 W/m² | Transparency, pixel coverage, brightness, installation environment |
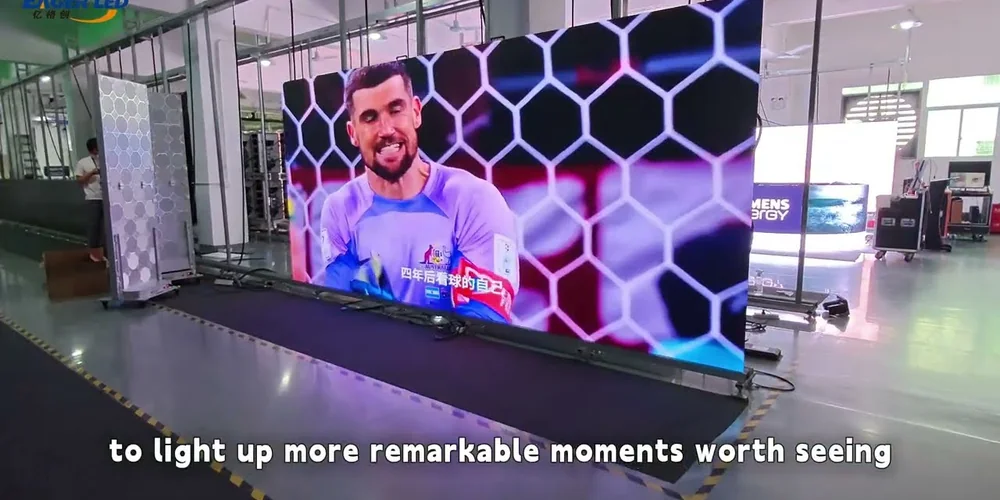
| Outdoor advertising LED screen | About 300-600 W/m² | High daylight brightness, weather, ventilation, content |
| Stadium or perimeter display | About 300-650 W/m² | Brightness, long runs, cabinet type, climate |
Maximum values can be substantially higher than these average planning ranges. Fine pixel pitch does not automatically mean the highest real-world energy use: an indoor wall may run at far lower brightness than an outdoor P10 billboard. Compare complete systems at the required luminance and image quality, not isolated W/m² labels.
6. What Affects LED Display Power Consumption?
6.1. Brightness and ambient light
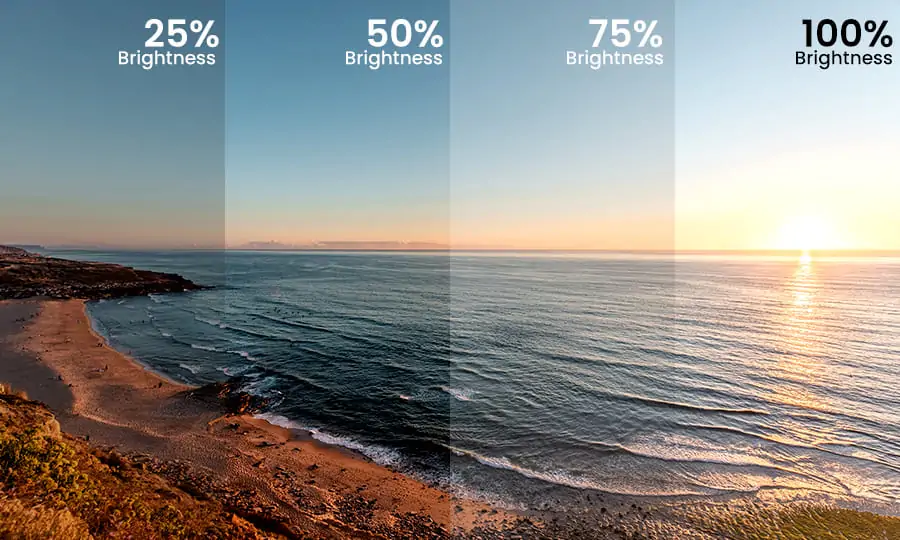
Brightness is one of the strongest controllable variables. Outdoor screens require enough luminance to remain readable in daylight, while indoor displays can often operate comfortably at a much lower output. An ambient-light sensor and a carefully limited brightness schedule can reduce unnecessary consumption without making the image look dull.
6.2. Content color and average picture level
Direct-view LEDs are emissive. Full white activates red, green, and blue subpixels strongly; dark scenes and black backgrounds require less LED current. Average picture level (APL) describes how bright the image is across the frame. A content playlist dominated by white retail layouts will not have the same average load as dark concert graphics, even on identical hardware.
6.3. Pixel pitch, pixel density, and scan mode
A smaller pixel pitch places more pixels in each square meter. That can increase driver and LED density, but pitch alone cannot predict system power. LED package efficiency, scan ratio, current settings, brightness target, and driver architecture also matter. Use the EagerLED pixel pitch guide to choose resolution from viewing distance, then compare power at the required operating brightness.
6.4. Power supplies, drivers, temperature, and cooling
Every conversion and control stage produces losses. Power-supply efficiency changes with load and temperature, while poor ventilation can raise component temperature and cooling demand. Common-cathode driver systems can supply red, green, and blue LEDs from more appropriate voltage rails instead of dissipating excess voltage as heat. Texas Instruments documents this separated-supply approach in its LP5891 common-cathode LED driver data sheet. The actual saving still depends on the complete display design and operating point.
7. Worked LED Screen Energy and Cost Examples
7.1. A 10 m² indoor retail LED wall
Assume a 10 m² indoor display with verified average screen power of 250 W/m², 0.3 kW of processing and auxiliary load, 12 operating hours per day, 30 days per month, and an electricity tariff of $0.15/kWh.
- Screen power:
10 x 250 / 1,000 = 2.5 kW - Average system power:
2.5 + 0.3 = 2.8 kW - Daily energy:
2.8 x 12 = 33.6 kWh - Monthly energy:
33.6 x 30 = 1,008 kWh - Monthly cost:
1,008 x $0.15 = $151.20
7.2. A 50 m² outdoor advertising screen
Assume a 50 m² billboard averaging 420 W/m², plus 2 kW for processing, ventilation, and other auxiliary loads. It operates 16 hours per day, 365 days per year, at $0.15/kWh.
- Screen power:
50 x 420 / 1,000 = 21 kW - Average system power:
21 + 2 = 23 kW - Annual energy:
23 x 16 x 365 = 134,320 kWh - Annual cost:
134,320 x $0.15 = $20,148
If measured average system power can be reduced by 20% without compromising the required brightness, annual energy falls by 26,864 kWh and the simple annual saving is $4,029.60 at the same tariff. This illustrates why a large, long-running display should be evaluated on lifetime operating cost, not purchase price alone.
8. Size Electrical Infrastructure from Maximum Load
Average power is appropriate for cost forecasting, but it is not the correct basis for every electrical decision. Feeders, distribution boards, protective devices, phase balancing, connectors, and backup power must be engineered for the applicable maximum load, inrush behavior, ambient temperature, cable length, installation method, and local code.
Request a power schedule that identifies:
- Maximum and expected operating power for every cabinet
- Input voltage, frequency, power factor, and current
- Number and distribution of power inputs
- Controller, processor, fan, heater, and cooling loads
- Earthing, surge protection, emergency isolation, and maintenance access
- Expansion or redundancy requirements
A qualified local electrical professional should approve the final design. Do not select a breaker or cable size from an online W/m² estimate alone.
9. How to Reduce LED Screen Power Consumption
9.1. Calibrate brightness by time and ambient light
Establish daytime, evening, and nighttime brightness targets, then verify readability and visual comfort at each setting. Use a reliable light sensor where conditions change substantially. Avoid operating at 100% simply because the hardware allows it.
9.2. Schedule real shutdowns
A black playlist is not the same as switching the system off. Define an approved startup and shutdown sequence that removes power from equipment that does not need to remain energized while preserving any required monitoring or safety functions.
9.3. Design content for efficient visibility
Dark backgrounds and high-contrast graphics often consume less energy than large white fields on an emissive display. Efficiency should not undermine brand requirements or accessibility, but content teams can avoid unnecessary full-white layouts and still achieve clear communication.
9.4. Specify efficient hardware and thermal design
Compare LED efficacy, driver architecture, power-supply efficiency, cabinet airflow, and operating temperature. Common-cathode or other energy-saving designs should be judged from measured complete-screen power at the required brightness, not a headline percentage. Better thermal management can also reduce cooling energy and stress on electronic components.
10. Compare Energy-Saving Screens by Payback and TCO
An efficient LED display may cost more initially, but the relevant comparison is total cost of ownership (TCO) over the planned service life.
Annual energy saving = Baseline annual kWh - Efficient-screen annual kWh
Annual cost saving = Annual energy saving x Effective tariff
Simple payback (years) = Additional purchase cost / Annual cost saving
Include cooling, maintenance, spare parts, downtime, and any demand-charge effect when they are material. Require bidders to state test brightness, content pattern, voltage, cabinet configuration, ambient conditions, and whether auxiliary equipment is included. A claim of “50% lower power” is not comparable if one screen was tested at lower luminance or with different content.
For a transparent retail screen, also evaluate daylight performance and transparency. The EagerLED transparent LED video wall guide explains why brightness, pixel pitch, structure, and viewing conditions must be assessed together. For conventional display alternatives, see the LCD vs LED display comparison.
11. FAQs
12. Conclusion
A dependable LED screen power consumption estimate separates three jobs. Use maximum rated load for electrical engineering, realistic average load for electricity budgeting, and measured system data for optimization. Always include the active area, operating schedule, brightness, content, auxiliary equipment, cooling, and actual tariff.
For a new project, ask every supplier to quote maximum and typical power under stated test conditions. Then compare the same screen area, luminance, content profile, and operating hours. That process reveals the true operating cost and shows whether an energy-saving display will repay its additional purchase price.
 How to Choose LED Screen Brightness: Nits by Application
 Top 10 LED Display Suppliers in Australia (2026 Guide)
Related Posts

Fill In Your Needs In Detail
Fill in the screen usage scene and size you need in “Content”.You will get a quote.