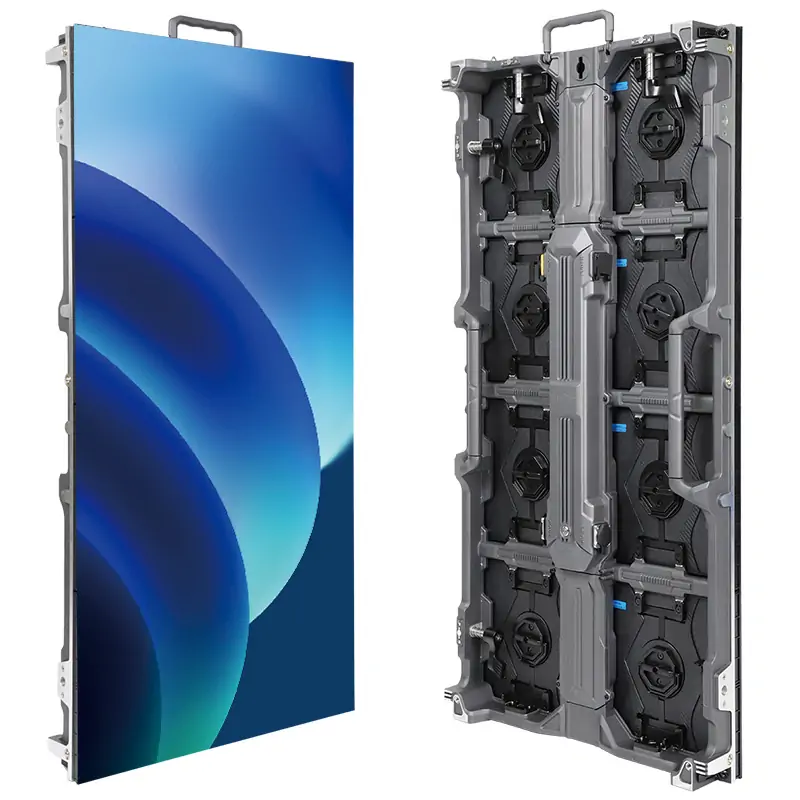
LED wavelength is the distance between repeating points of a light wave, usually expressed in nanometers (nm). It helps describe an LED’s color and spectral output. Blue LEDs often operate around 450–485 nm, green around 520–540 nm, and red around 620–660 nm, depending on the product. Real LEDs emit a band of wavelengths; white light has no single wavelength.
For indoor LED displays, wavelength consistency contributes to color uniformity. However, output, temperature, optics, and calibration also matter. In lighting, horticulture, or medical devices, the wavelength must be considered alongside the delivered light level and the application’s requirements.
This guide explains color ranges, peak versus dominant wavelength, the photon-energy formula, and spectral power distribution (SPD). Use the examples to understand a datasheet, then confirm the specific component’s wavelength definition, tolerance, and test conditions before ordering.
1. What is LED Wavelength? It’s More Than Just Color
Like the spacing between water-wave crests, wavelength describes a repeating distance. Light is an electromagnetic wave, and one nanometer is one billionth of a meter. Wavelength values in LED specifications normally refer to light in air or vacuum.
A colored LED has a spectral peak and a finite bandwidth, rather than emitting only one exact wavelength. Its perceived color depends on the whole spectrum and the eye’s response, so a wavelength label alone does not fully specify appearance.
Different spectral bands suit different tasks: visible light produces display colors, while ultraviolet and infrared support specialized processes and sensing. Neither an invisible beam nor a particular color is automatically safe or effective for a given application.
The key relationship is photon energy:
- Shorter wavelengths, such as violet and blue, carry more energy per photon.
- Longer wavelengths, such as red, carry less energy per photon.
This does not mean that a blue LED necessarily uses more electricity or produces more total optical power.
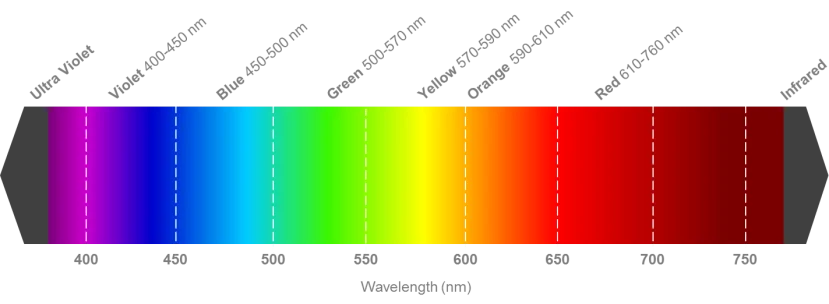
A “625 nm red LED” still needs a tolerance and a statement of whether 625 nm is peak or dominant wavelength. The illustration below shows approximate color regions; its boundaries are descriptive, not procurement specifications.
| Color | Wavelength shown |
|---|---|
| Violet | 400–450 nm |
| Blue | 450–500 nm |
| Green | 500–570 nm |
| Yellow | 570–590 nm |
| Orange | 590–610 nm |
| Red | 610–760 nm |
2. Key LED Wavelengths & Their Applications
Color names have approximate boundaries and sometimes overlap. The broad visible ranges below describe colors; the narrower examples describe LED products. Do not substitute one for the other when comparing suppliers.
- Visible light: includes violet, blue, green, yellow, orange, and red. RGB displays mix red, green, and blue light to produce many colors.
- Invisible radiation: ultraviolet lies beyond the short-wavelength end of visible light; infrared lies beyond the long-wavelength end.
2.1 Red LED Wavelength (~620–750 nm)
RGB means red, green, and blue—the additive primaries used by full-color LED screens. Each channel contributes its own spectrum. Changing their relative outputs creates mixed colors, including white; it does not turn them into a new single-wavelength emitter.
Red LEDs are common in indicators, signs, and displays. As a manufacturer example, Lumileds’ LUXEON Rebel Color table lists red products at 620–645 nm and deep-red products at 650–670 nm. These are product ranges, not universal definitions or evidence that red is always the most efficient choice.
Deep red around 660 nm is also used in horticultural lighting. It contributes to photosynthesis, but selecting that wavelength alone does not guarantee flowering or higher yield. The complete spectrum, photon delivery, crop, and lighting schedule must be considered.
2.2 Blue LED Wavelength (~450–495 nm)
Blue LEDs support RGB displays and many phosphor-converted white LEDs. Lumileds, for example, lists blue products at 460–485 nm and royal blue at 440–460 nm. In a white LED, a phosphor converts some excitation light into longer wavelengths; the combined spectrum can appear white.
Other uses: violet or blue sources can activate suitable photoinitiators in curing systems. A nominal 415 nm source is usually described as violet, not a universal curing specification. Match the material’s absorption, irradiance, exposure time, and geometry to the equipment supplier’s validated process.
2.3 Green LED Wavelength (~495–570 nm)
Green LEDs commonly operate near 520–540 nm; 455 nm is blue. The standard photopic response used for daylight vision peaks near 555 nm in the yellow-green region. See the CIE photopic spectral-efficiency data.
Perceived brightness: equal radiant power at different wavelengths does not produce equal luminous output. Light nearer the photopic sensitivity peak receives greater weighting. Equal electrical power is a different comparison because LED conversion efficiency also varies.
Display color gamut: green is one of three RGB primaries. The chromaticities of all three channels, the selected white point, and calibration determine the usable color gamut; green wavelength alone cannot guarantee realistic images.
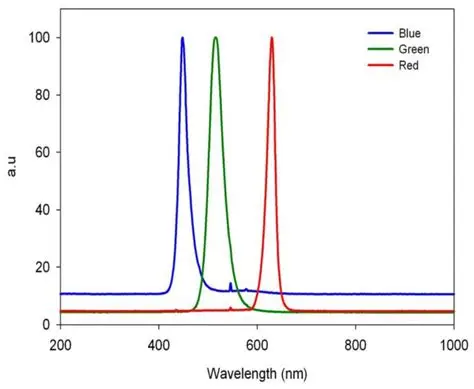
Compare brightness and power at the intended operating temperature, not by color name. The RGB chart below is illustrative: blue, green, and red curves peak at roughly 450, 520, and 630 nm. Its vertical axis is in arbitrary units (a.u.); equal plotted peak heights do not establish equal watts, lumens, or electrical efficiency.
2.4 Yellow, Orange, Purple and White Light
Yellow and orange can be spectral colors or mixtures. Purple is a mixture rather than a single spectral wavelength, while white requires a combination of wavelengths. These distinctions prevent misleading specifications.
- Yellow LED: yellow is approximately 570–590 nm in the illustration. Direct-emitting and phosphor-converted products can have different spectra. A blue chip with yellow phosphor commonly produces white when blue light remains in the output; that construction alone does not define a yellow LED. Check the measured color coordinates.
- Orange LED: orange is approximately 590–610 nm in the illustration, with neighboring amber and red-orange product labels varying by manufacturer. Indicators and signage should be specified by measured color and applicable requirements, rather than a color name alone.
- Purple LED: mixed red and blue light can appear purple. It has no single purple wavelength. Violet is a spectral color near the short-wavelength end of visible light; 365 nm is ultraviolet, not purple visible light. A purple-looking product should be described by its component spectra or chromaticity.
- White LED: phosphor conversion or additive color mixing creates white light. Specify correlated color temperature (CCT), chromaticity or Duv, and the relevant color-rendering measures for illumination. Two products with the same CCT may still differ in tint, spectrum, and how illuminated objects appear.
2.5 UV and IR Wavelengths
Ultraviolet and infrared LEDs extend beyond visible display colors. Specify the required spectral band and optical output, as well as detector compatibility, exposure limits, and application testing.
- UV: the ultraviolet region spans roughly 100–400 nm, but that does not mean LED products cover every wavelength in it. UVC sources are used in disinfection systems; wavelength alone does not prove a disinfection dose or result. FDA guidance warns that UVC exposure can injure eyes and skin.
- IR: near-infrared LEDs are used in remote controls, sensing, and camera illumination. Match the emitter spectrum to the receiver’s sensitivity. Invisible output must not be treated as harmless simply because the eye cannot see it.
3. Advanced Considerations: Where the Pros Live
Two datasheets can quote similar nanometer values while describing different measurements. Confirm the wavelength definition before choosing bins or approving a substitute component.
3.1 Dominant vs. Peak Wavelength
Peak and dominant wavelength describe different properties of a colored LED:
- Peak wavelength (λp): the wavelength at the maximum of its spectral power distribution.
- Dominant wavelength (λd): a colorimetric description derived from chromaticity and a reference white point, rather than the location of the spectral peak.
Luminus explains the distinction and why white LEDs should use CCT and Duv instead of dominant wavelength.
For a display-color comparison, request chromaticity and the supplier’s bin definition. For a detector, filter, or photochemical process, examine the full spectrum and bandwidth. Never assume that peak and dominant wavelength values are interchangeable.
3.2 The Voltage Connection
Semiconductor composition influences both emission and electrical behavior, but forward voltage is not a wavelength meter. Red emitters often have a lower forward voltage than blue or green emitters; actual values depend on the component, current, and temperature. Size the driver using the datasheet’s forward-voltage range and current limits, not a color-based rule.
4. Critical Applications of LED Wavelength
In biological applications, wavelength is only one part of a complete exposure specification. Delivered intensity, duration, distance, and the evidence for the actual device or growing system matter just as much.
4.1 LED Wavelength for Skin
- Blue-light skin treatments: some devices treat inflammatory acne, but results vary and light does not treat every acne type. The American Academy of Dermatology’s acne guidance describes these limitations.
- Red-light treatments: research includes red and near-infrared devices for skin concerns, but results from one device or protocol do not establish benefits for every LED at a similar wavelength. The AAD’s red-light guidance notes remaining evidence gaps.
Choose a device with appropriate indications and follow its instructions and professional advice. A display LED specification is not a medical treatment prescription.
4.2 Horticultural Lighting
Horticultural systems commonly combine blue and red, sometimes with broad-spectrum white or other bands.
- Blue around 450 nm: contributes to photosynthesis and plant development.
- Red around 660 nm: contributes to photosynthesis, with responses depending on the complete lighting recipe.
Green light also contributes to plant growth; it is not simply wasted because leaves look green.
Assess canopy photosynthetic photon flux density (PPFD), daily light integral (DLI), uniformity, and energy use. Michigan State University’s seedling experiments illustrate why spectrum and crop response must be evaluated together. Validate the recipe with the actual crop and growing conditions before projecting yield or return on investment.
5. How does an LED create a Specific Wavelength?
An LED produces light through electroluminescence: electrical injection allows electrons and holes to recombine in a semiconductor’s active region, releasing some of their energy as photons.
The basic junction contains:
- N-type material: where electrons are the majority charge carriers.
- P-type material: where holes are the majority charge carriers.
With forward bias, carriers are injected toward the active region. Modern LED structures are engineered to encourage radiative recombination. Not all supplied electrical energy becomes light; nonradiative processes and electrical losses also generate heat.
- The semiconductor’s band structure influences the photon energies that can be emitted.
- Higher-energy photons correspond to shorter wavelengths; lower-energy photons correspond to longer wavelengths.
6. The LED Wavelength Formula
The photon-energy relationship is E = hc/λ. Using electronvolts for energy and nanometers for wavelength gives:
λ (nm) ≈ 1239.84 / E (eV)
Here, λ is wavelength, E is photon energy, h is Planck’s constant, and c is the speed of light in vacuum. The conversion follows the NIST fundamental constants; 1240 is a convenient rounded numerator.
Example: a 2.00 eV photon has a wavelength of approximately 620 nm. This calculation converts a photon energy to wavelength; it does not predict an LED’s exact production bin.
A semiconductor bandgap can provide an approximate emission-energy guide, but device structure and operating conditions affect the measured spectrum. Do not insert the LED’s forward voltage directly into the photon-energy formula.
Manufacturers use different semiconductor alloys and active-region designs to obtain different colors. Changing composition changes the available electronic transitions.
- Indium gallium nitride (InGaN): widely used for blue and green emitters.
- Aluminum gallium indium phosphide (AlGaInP): widely used for red, orange, and amber emitters.
Material names explain the underlying approach, but the component datasheet and measured spectrum remain the basis for selection. Phosphors can further change the final output spectrum.
7. The LED Wavelength Chart (SPD)
A spectral power distribution (SPD) chart shows how optical output is distributed across wavelength. It reveals bandwidth, multiple emission bands, and differences hidden by a single nominal wavelength or color label.
- Horizontal axis: wavelength, usually in nm.
- Vertical axis: spectral output, with units such as W/nm, or a relative/normalized scale. Read the label.
- Peak and width: identify the maximum and, when specified, full width at half maximum (FWHM).
- White light: many phosphor-converted LEDs show a blue peak plus broader longer-wavelength emission.
7.1 Why an LED Wavelength Chart Matters
- Precision: compare spectra measured under stated current and temperature conditions.
- Binning: use the supplier’s wavelength, chromaticity, and output-bin tables; an SPD image alone does not define acceptance limits.
- Color matching: different spectra can produce similar color coordinates yet behave differently with cameras, filters, or illuminated materials. Test the complete application.
8. How to Choose the Right LED Wavelength: A Practical Checklist
- Define the goal: display color, illumination, sensing, plant lighting, or a validated treatment/process.
- Specify appearance correctly: use chromaticity and tolerances for color matching; add CCT and tint criteria for white light.
- Request the full datasheet: confirm peak versus dominant wavelength, SPD, bandwidth, output, current, and test temperature.
- Agree a bin strategy: choose tolerances that meet the project’s needs and replacement-stock plan. The tightest available bin is not automatically necessary.
- Check operating stability: test at the expected temperature and drive level, including dimming and thermal stabilization.
- Set supplier acceptance checks: approve samples, record component/bin references, and verify assembled-display uniformity and calibration.
9. FAQS
10. Conclusion
LED wavelength is a useful starting point for specifying color and spectral performance. Reliable selection also requires the correct measurement definition, tolerances, operating conditions, and application tests. Compare complete specifications rather than promises attached to a single nanometer value.
For a display, judge the calibrated screen as well as its individual LED components.
Discuss your display size, viewing conditions, color targets, and maintenance requirements with EagerLED. Ask which component data and sample tests are available for the proposed system.
Contact the EagerLED team about your LED display project and agree measurable acceptance criteria before production.
 Difference Between LCD and LED Display: Complete Guide
 NovaStar H5 Video Wall Splicer: Specs, Cards & Setup
Related Posts



Fill In Your Needs In Detail
Fill in the screen usage scene and size you need in “Content”.You will get a quote.