Grayscale in LED displays is the brightness resolution available to each red, green and blue channel. An n-bit value has 2n possible codes: 14-bit provides 16,384 and 16-bit provides 65,536 per channel. Actual image quality depends on how the complete display reproduces those codes, especially in dark gradients and at reduced brightness.
Separate source bit depth, internal processing precision and LED-driver PWM resolution when comparing specifications. A high driver bit count does not restore detail missing from the source, and it does not guarantee that every output step is measurable or visually distinct. Calibration, signal levels, timing and the operating brightness all affect the result.
This guide explains grayscale, PWM, image-quality checks and practical buying tests. The principles apply across LED products, from an LED poster screen to a larger video wall. Start with the intended content and viewing conditions, then ask the supplier to demonstrate the proposed configuration.
1. What Is Grayscale in LED Displays?
In an RGB LED display, each pixel combines independently controlled red, green and blue emitters. Adjusting their relative light output creates colors; balancing them to the chosen white point creates neutral gray. Grayscale resolution describes the available brightness steps within each channel. It is different from the number of physical pixels, and it does not mean the screen displays only black-and-white images.
1.1 Bit Depth and Brightness Levels
Each additional bit doubles the number of numerical codes. The table gives theoretical full-range combinations for equal bit depth in all three RGB channels; these are not counts of colors that a viewer can necessarily distinguish.
| Bit Depth | Gray Levels (per color) | Theoretical RGB Combinations |
|---|---|---|
| 8-bit | 256 | 16.7 million |
| 10-bit | 1,024 | 1.07 billion |
| 12-bit | 4,096 | 68.7 billion |
| 14-bit | 16,384 | 4.4 trillion |
| 16-bit | 65,536 | 281 trillion |
Levels per channel = 2n; RGB combinations = (2n)3 = 23n. Codes run from 0 to 2n − 1. For example, 8-bit RGB has 256 codes per channel and 16,777,216 possible triplets.
Signal formats may reserve some codes, and physical output is limited by the source, processing, calibration and LEDs. More numerical combinations do not enlarge the display’s color gamut or prove accurate near-black reproduction.
1.2 Why Grayscale Matters for Image Quality
Grayscale performance affects three visible qualities:
Gradient smoothness. Skies, skin tones and softly lit backgrounds should change gradually. Visible contours can come from quantization, compression, processing or the display itself, so inspect the source before blaming the driver’s bit depth.
Shadow detail. Dark textures should remain distinguishable at the intended room lighting and screen output. Crushed blacks can result from incorrect signal-range settings as well as limited output precision.
Low-gray neutrality. Gray patches should remain balanced rather than turning pink, green or blue. Channel response, calibration and drive timing can affect this balance; a single advertised grayscale number does not describe all three.
2. How Grayscale Works: PWM and Bit Depth
LEDs are semiconductor light sources whose output depends on current, temperature and device characteristics; they are not inherently digital switches. Drivers commonly combine controlled current with pulse-width modulation (PWM). This allows numerical image values to control average light output without requiring every gray level to use a different continuous current.
2.1 PWM: The Core Principle
In a simplified fixed-current PWM example, the driver switches a channel on and off and changes its duty cycle: on-time divided by the complete period. With stable on-state output, average emitted light is approximately proportional to duty cycle. Perceived brightness is not proportional in the same way.
- 100% duty cycle: continuously on during the available drive interval.
- 50% duty cycle: on for half the interval, producing approximately half the average light of the 100% case.
- 0.1% duty cycle: a very short on-time, subject to the hardware’s minimum useful pulse length.
These examples assume a static channel; multiplexed panels also divide time between scan rows. PWM can reduce color changes associated with varying current, but it does not guarantee perfect neutrality at every setting. Analog current adjustment is also a legitimate dimming method, as Texas Instruments explains in its dimming guide. Actual display drivers may use both approaches.
2.2 The Grayscale Clock
A grayscale clock, or GCLK, supplies timing increments for many PWM drivers. In a simplified static 16-bit PWM model with 65,536 time slots at 60 cycles per second, the slot duration is 1/(60 × 65,536), approximately 254 ns; the clock frequency is approximately 3.93 MHz. This is an explanatory calculation, not a panel specification. Scan rows, blanking time, clock multiplication and PWM architecture change the real timing budget.
2.3 The Flicker Problem and Scrambled PWM
A basic PWM scheme can place a channel’s on-time in one pulse per cycle. At low gray values that pulse may be short and widely separated from the next. Visibility of flicker depends on repetition rate, pulse pattern, brightness, viewing conditions and motion; a camera introduces its own exposure timing. A 60 Hz content frame rate should not be confused with the LED drive’s advertised refresh rate.
Scrambled PWM distributes available on-time across multiple periods to improve temporal performance. Macroblock’s MBI5251 description, for example, documents scan-type S-PWM, selectable 13–16-bit resolution and a GCLK multiplier. The exact schedule is specific to the driver and its configuration.
Splitting a frame into 32 segments does not mean that one minimum-length pulse becomes 32 even shorter valid pulses. At the lowest code values, there may be too little on-time to place a pulse in every segment. Consequently, multiplying frame rate by segment count is not sufficient to prove a uniform refresh rate at every gray level or guarantee flicker-free camera footage.
2.4 MSB-LSB Split and Dithering
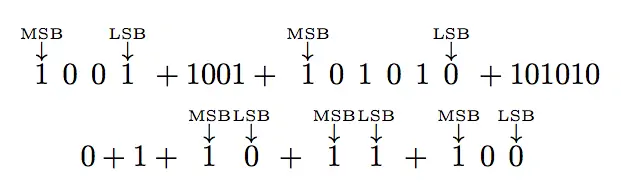
MSB means most significant bit; LSB means least significant bit. In unsigned binary 1001, the leftmost bit has weight 8 and the rightmost has weight 1, giving decimal 9. The illustration below labels these bit positions. It is a binary-significance illustration, not a measured PWM waveform or a universal driver timing diagram.
Some enhanced PWM architectures divide data into upper and lower bit groups. Other systems use temporal dithering to distribute fractional output over time. Both require implementation-specific timing; dithering may improve apparent gradation while introducing visible noise. Brompton’s Dark Magic documentation explicitly notes this low-brightness quality/noise trade-off.
3. Key Performance Metrics Beyond Bit Depth
Evaluate tonal response, low-brightness behavior and timing together. Record the input format, processor settings and target luminance before comparing screens. Otherwise, two demonstrations with the same “16-bit” label may be operating under very different conditions.
3.1 Grayscale Linearity
Distinguish linear-light response from the transfer function used for video. A 50% PWM duty cycle can produce roughly 50% average light, but a 50% encoded video value need not do so. For example, the W3C’s sRGB conversion equations map an encoded value of 0.5 to about 0.214 in linear light. This calculated example assumes normalized sRGB and does not specify an LED panel’s calibration target.
Measure output against the intended gamma or electro-optical transfer function rather than expecting a straight line from encoded input to luminance. Short-pulse response, channel mismatch and calibration can introduce departures from that target. There is no universal count of “lost” low-gray codes.
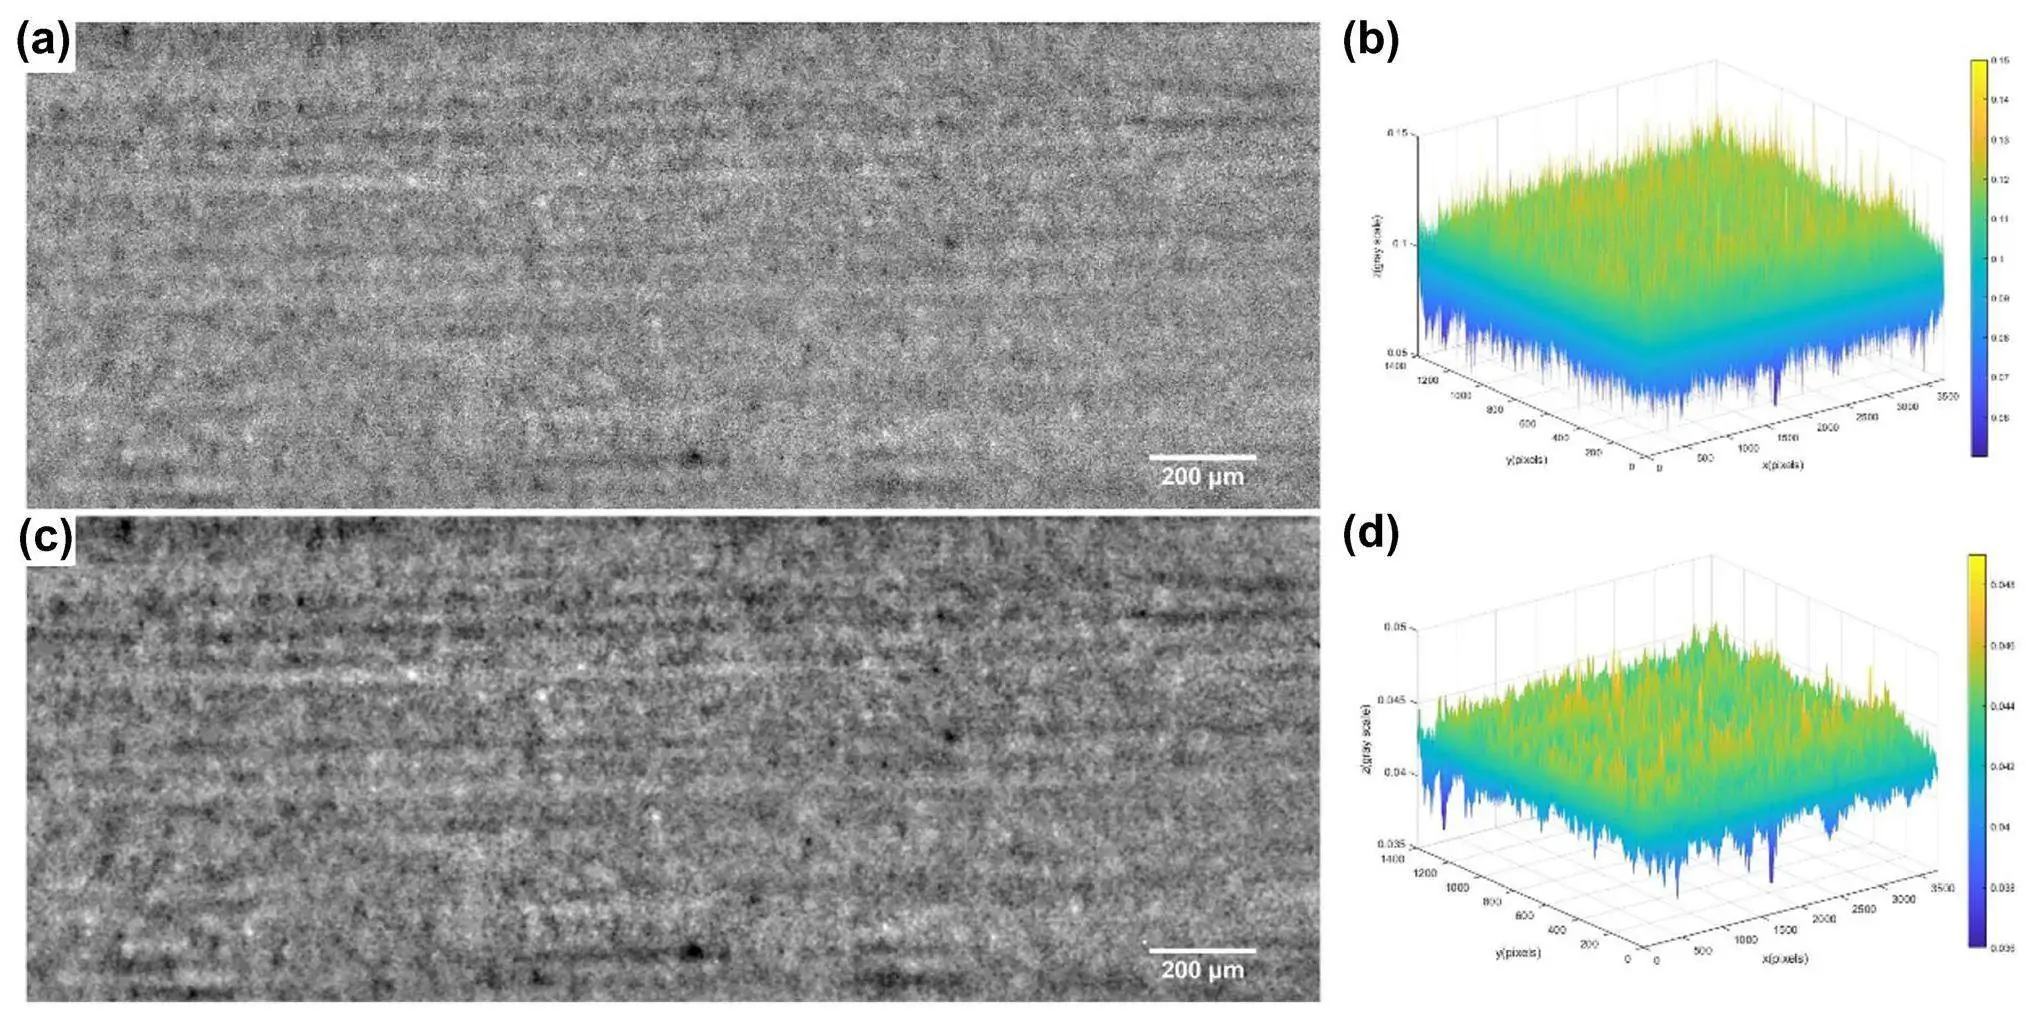
The retained image below contains grayscale textures and three-dimensional gray-value plots, including 200 µm scale bars. Its source and test conditions are not established here, so it should not be treated as evidence of an LED display’s grayscale linearity.
3.2 Low-Brightness Grayscale Performance
First-scan dim lines: inspect uniform dark fields for row-dependent brightness differences associated with scan timing and settling.
Low-gray color cast: check whether dark neutral patches stay balanced across the panel and at different output settings.
Ghosting or coupling: look for unintended light beside bright objects on a dark background. Circuit design and timing matter; TI’s TLC5958 is one example of a driver with a pre-charge FET intended to address ghosting.
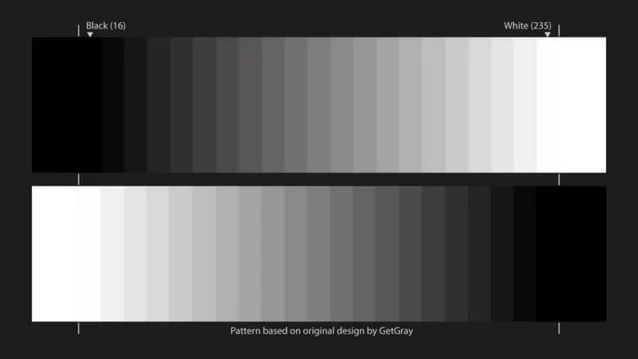
The pattern below labels black as 16 and white as 235, consistent with nominal 8-bit limited-range video. Match the player and processor range settings; those endpoints are not the 0–255 endpoints of full-range RGB.
3.3 Refresh Rate vs. Grayscale: The Trade-Off
For a fixed clock and simple PWM schedule, shorter cycles leave fewer timing slots. Practical drivers use scanning, memory, segmented PWM and other techniques, so there is no single bit-depth-versus-refresh equation that describes every LED wall.
Simple static model: PWM cycle frequency ≈ GCLK frequency ÷ 2n. This omits multiplexing and blanking and must not be used as the advertised refresh rate of a segmented-PWM panel.
Compare the complete operating mode: driver model, scan ratio, grayscale setting, video frame rate, brightness and PWM refresh. TI’s TLC5958 specifications list 16-bit grayscale, a 33 MHz grayscale clock and support for up to 32-way multiplexing; those are distinct parameters, not interchangeable refresh numbers.
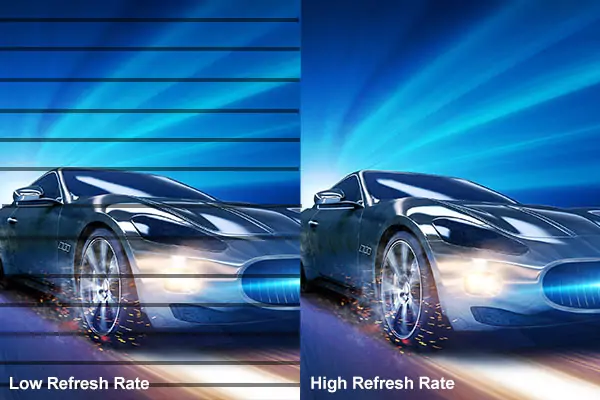
Neither 3,840 Hz nor 7,680 Hz is a universal guarantee of smooth gradients or clean camera footage. The car comparison below illustrates horizontal artifacts versus a cleaner image; it supplies no measured test conditions. Verify the proposed hardware with your content and, where relevant, your camera settings.
4. Grayscale in Real-World Applications
Choose acceptance tests around the application. A display intended for direct viewing and one intended for filming may need different timing and calibration settings even when their headline specifications match.
4.1 Fine-Pitch LED and Control Rooms
Control-room and close-viewing walls often show maps, interfaces, camera feeds and broad areas of similar color. Examine dark uniform fields and text at the real seating positions. Use pixel pitch and viewing distance to plan spatial detail; grayscale testing addresses tonal detail. A product such as an indoor GOB floor display has a different application and should not be taken as a control-room specification.
Test at the luminance operators will actually use, including dim evening conditions. Require a stable neutral gray, readable dark content and acceptable uniformity after calibration. There is no universal “14-bit minimum” that replaces these checks: the source precision, display configuration and room lighting all influence the result.
4.2 Outdoor LED Billboards
Outdoor advertising displays need sufficient luminance and contrast for the site’s ambient light. Check highlight separation as well as shadows. A bright screen can still clip near-white content because of source levels or processing, so maximum nits alone cannot demonstrate tonal quality.
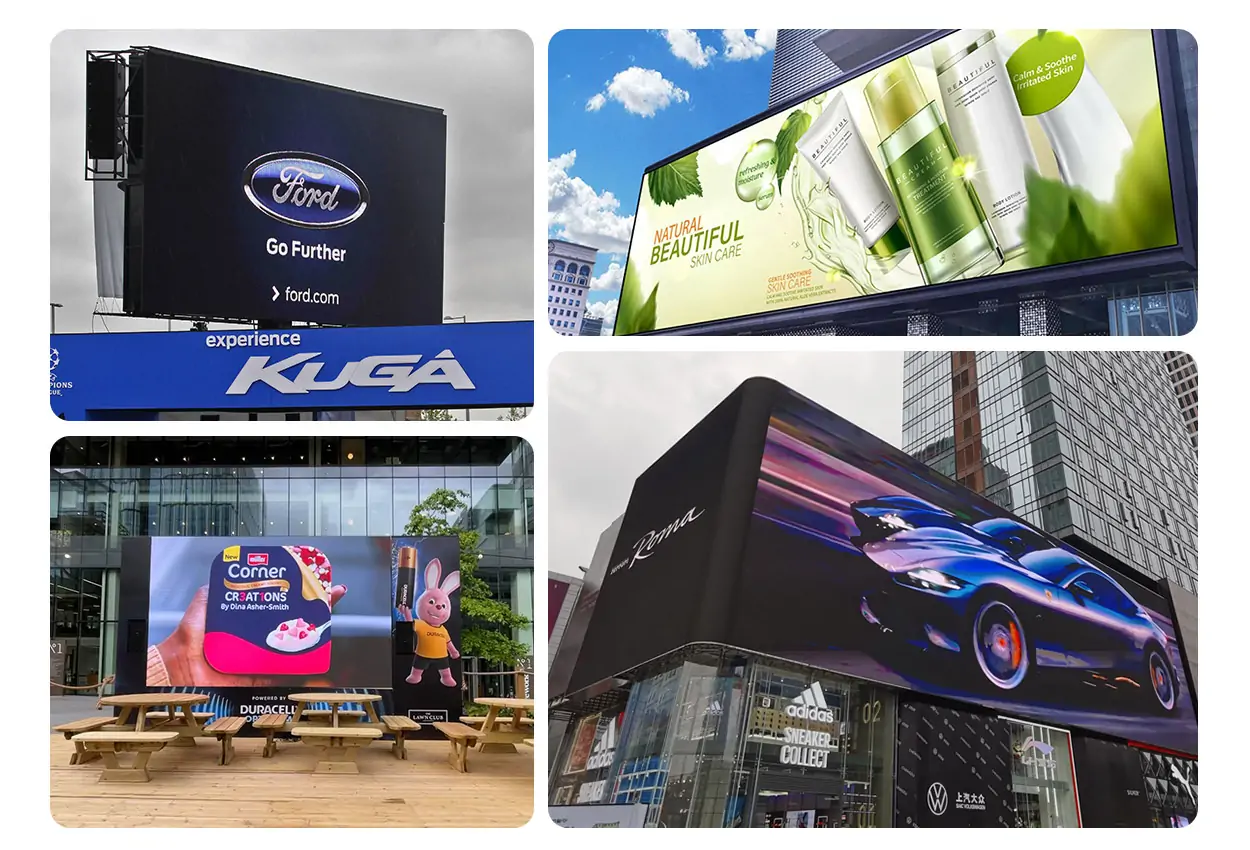
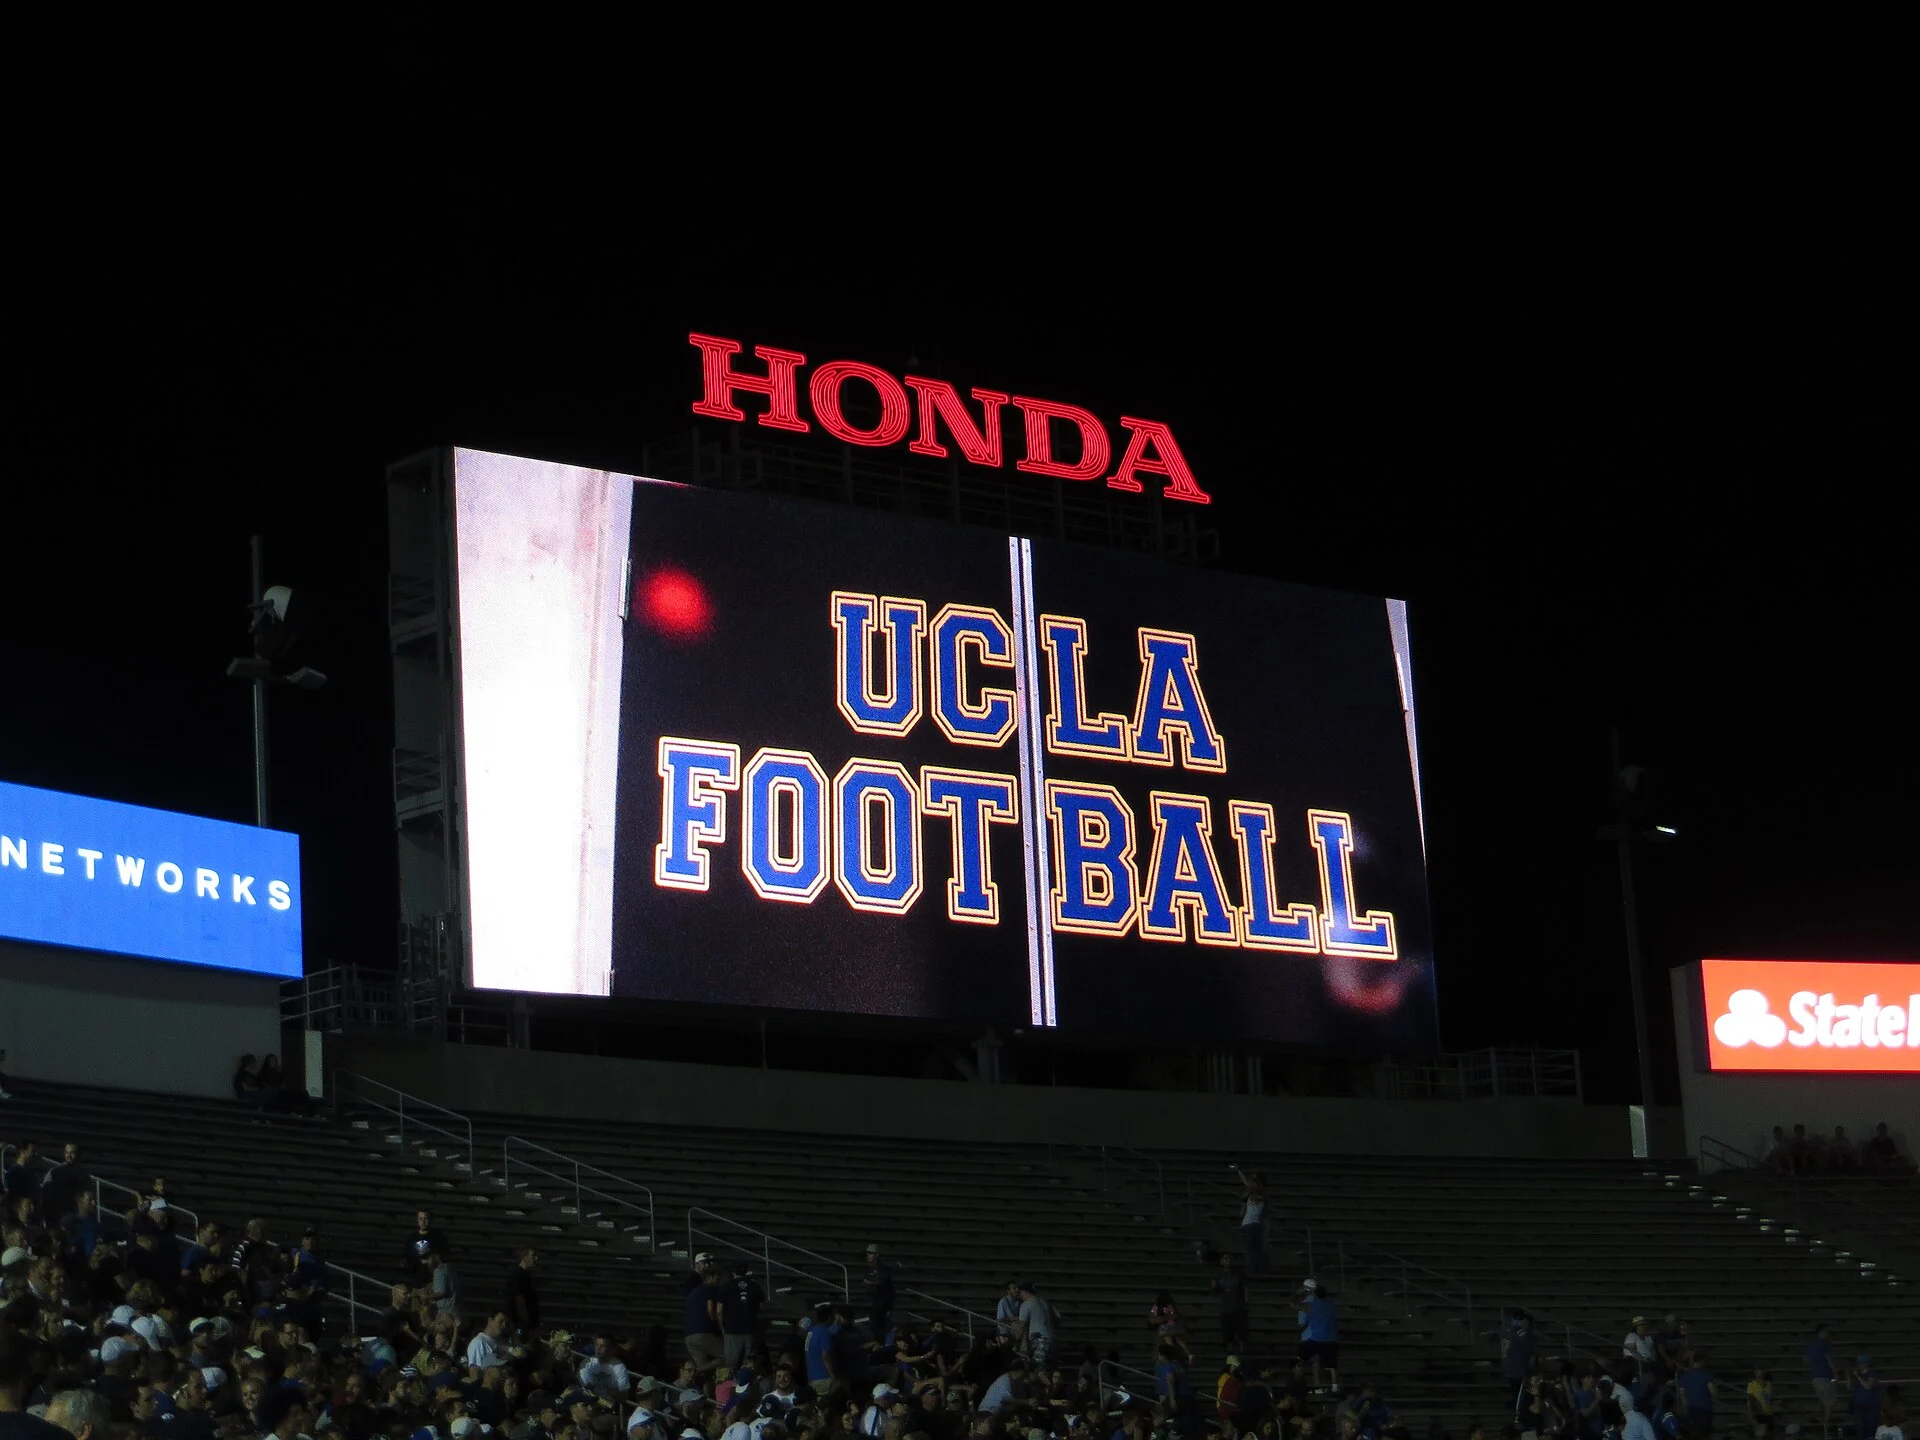
Repeat tests at the reduced output intended for nighttime use. Do not assume all outdoor displays use 12-bit grayscale or that distance makes banding irrelevant. Specify operating conditions and dimming behavior, and assess stability after the system has warmed up. The outdoor image shows several advertising applications; it is not a comparative grayscale measurement.
4.3 Virtual Production and XR Stages
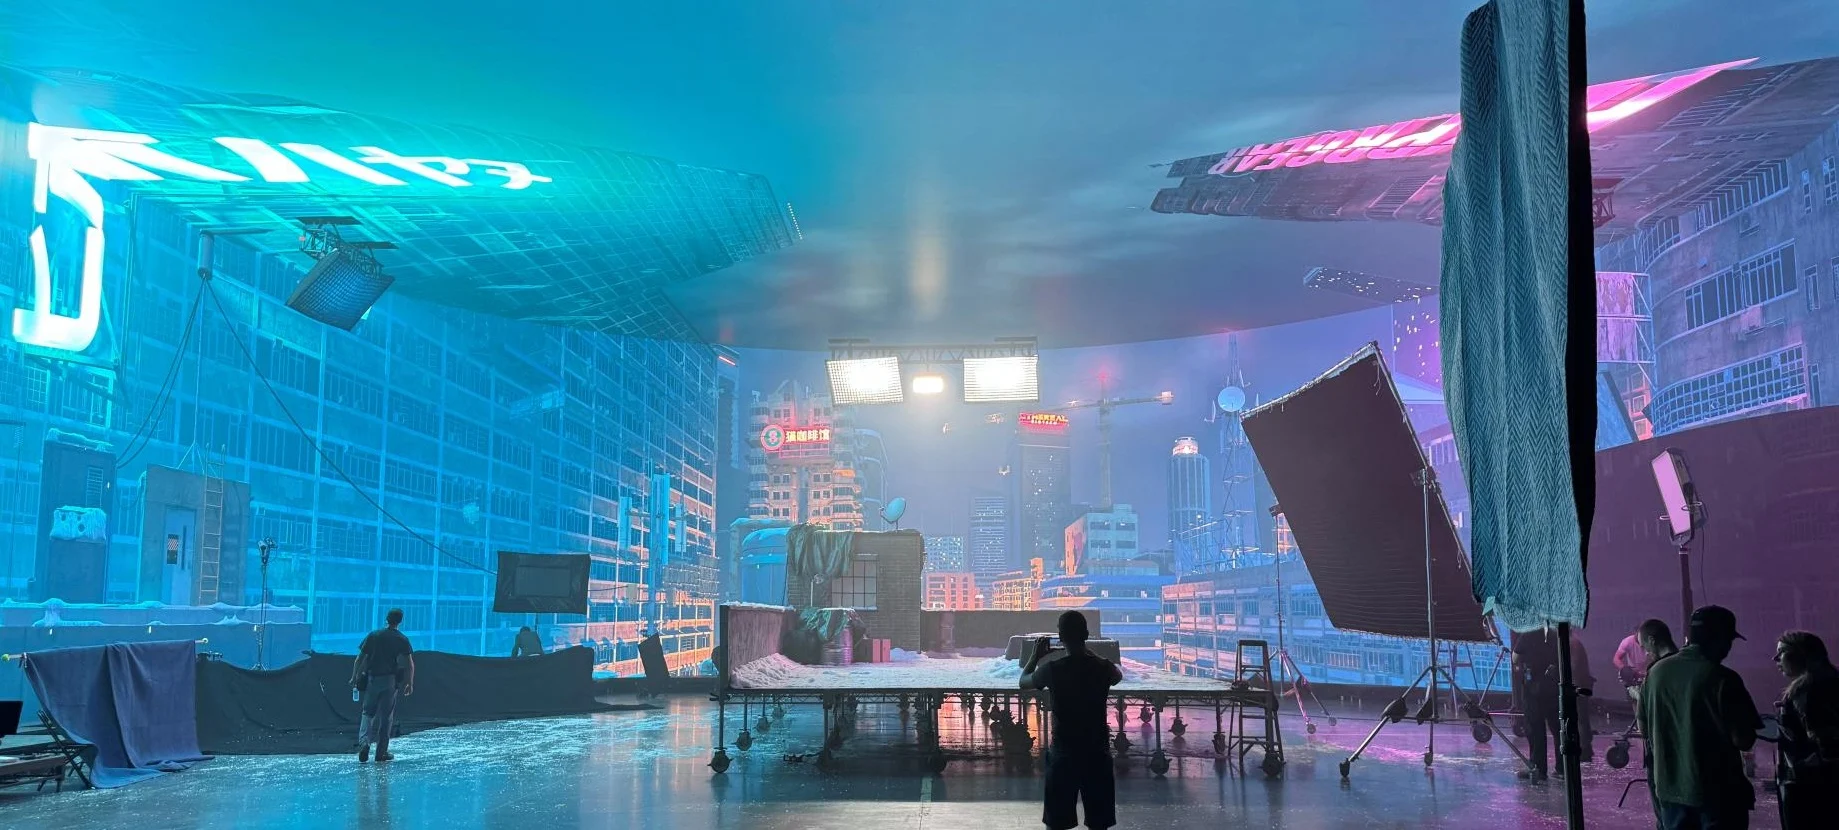
On virtual-production and XR stages, the wall can serve as both a background and a light source. Evaluate the recorded image as well as the direct view. Dark scenes and camera movement can reveal issues that a bright still demonstration does not show.
Camera timing: test the intended frame rate, shutter speed or angle, synchronization and panel scan mode. Rolling- and global-shutter cameras can respond differently to temporal light output. Brompton’s ShutterSync documentation describes matching LED refresh timing to the camera. It does not establish a universal requirement for 7,680 Hz on every stage.
Dark-scene gradation: inspect low-level ramps and neutral patches through the actual camera and color pipeline. Keep exposure, white balance and processing controlled when comparing modes. More PWM precision may help, but the result also depends on panel capabilities, frame rate and exposure duration, as described in Brompton’s Extended Bit Depth feature notes.
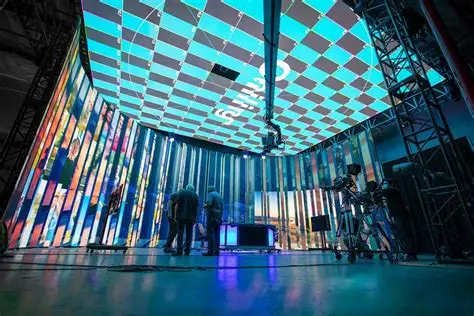
Check for unintended glow around bright objects, scan artifacts and unstable dark colors in recorded clips. Their visibility depends on exposure and processing, so camera tests should complement measured luminance and direct-view inspection. The retained stage photograph illustrates the installation context rather than a grayscale benchmark.
5. How to Evaluate and Test Grayscale Quality
Use a repeatable test sequence with the proposed source, processor and panel configuration. Record the settings and retain reference clips or measurements so that the delivered display can be checked against the demonstration.
5.1 The Gradient Test
Display a known black-to-white ramp at the intended viewing distance. Verify its bit depth and signal range, and avoid unnecessary compression or scaling. Check the same source on a trusted reference display to separate source defects from LED-wall defects.
- Banding: look for unintended contour steps in the smooth ramp, then check source encoding and processing before assigning a cause.
- Color tinting: neutral gray should not acquire localized pink, green or blue bands.
- Shadow clipping: use known near-black patches to check whether distinguishable input levels collapse together under the intended viewing conditions.
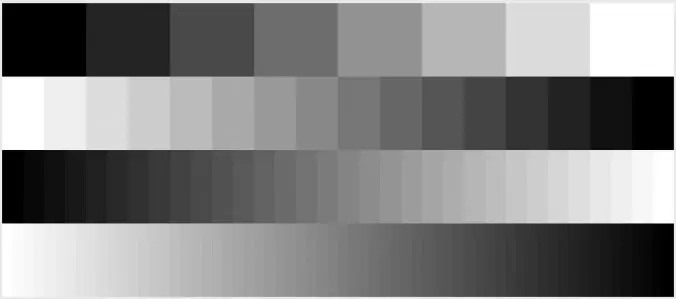
Bring your own patterns and representative content alongside the supplier’s demonstration. The illustration below contains both deliberately stepped bars and a smoother ramp: visible steps in a stepped pattern are intentional. A web image viewed through an unknown browser pipeline cannot certify a panel’s 14- or 16-bit output.
5.2 The 16-Step Grayscale Pattern
Use 16 known gray patches as a quick clipping and neutrality check. Inspect adjacent dark and light patches under controlled ambient light; confirm the expected endpoints for full- or limited-range input. If patches merge, investigate levels and calibration before concluding the hardware is defective. Passing a 16-patch test does not prove 16-bit performance: it samples only sixteen input values.
5.3 The Low-Brightness Stress Test
Repeat the patterns at the intended operating brightness and at a lower setting. A 30% control setting can be a useful example, but it is not a standardized luminance or a universal pass/fail threshold. Record measured nits where possible. Compare shadow separation, neutral color and noise, and note whether the controller changes current, PWM timing or processing as it dims.
5.4 Red Flags in Spec Sheets
- Unclear bit-depth stage: ask separately about source input, processing precision and driver output, including any dithering or extended-precision mode.
- Missing operating conditions: request grayscale performance together with scan mode, frame rate, brightness and refresh settings.
- No low-brightness evidence: request a demonstration or measurements rather than assuming quality from either the presence or absence of a specification.
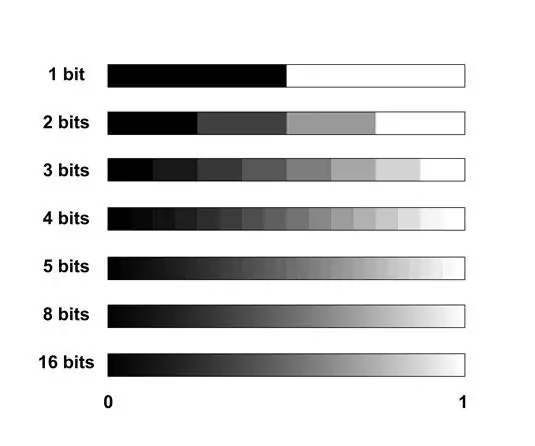
The illustration below shows theoretical levels increasing from 1 bit (2) through 2 (4), 3 (8), 4 (16), 5 (32), 8 (256) and 16 bits (65,536). Its normalized 0–1 axis represents black to white, not measured screen luminance.
6. Common Misconceptions About LED Grayscale
“Higher bit depth always means better image quality.”
Extra precision is useful only when the rest of the system can exploit it. Quantization, channel uniformity, transfer-function accuracy and content quality are separate issues. A higher number on the driver datasheet cannot correct every defect elsewhere in the chain.
“14-bit and 16-bit always look the same.”
They may look similar in one demonstration and differ in another. Additional output precision can help dark gradation after processing and dimming, but the visible benefit is configuration-dependent. Compare calibrated displays at equal luminance with challenging content instead of assuming an automatic improvement.
“Grayscale is the same thing as color depth.”
Bit-depth terminology must identify whether it refers to one channel or the whole pixel: 8 bits per RGB channel is 24-bit RGB. Color gamut, white point and color accuracy are separate characteristics, not additional bits. Neutral grayscale performance alone cannot establish accurate saturated colors.
“The human eye cannot see more than a fixed number of bits.”
There is no useful universal cutoff for buying a display. Visibility depends on contrast, adaptation, spatial pattern and the encoding curve. The practical question is whether contours, noise or lost detail are visible in the intended use. Assess the complete image rather than translating a general claim about vision into a mandatory driver specification.
7. FAQ
8. Conclusion
Choose an outdoor LED screen or indoor wall by demonstrated performance at its intended settings. Keep source precision, processing depth and PWM resolution separate, and ask for the operating mode behind each number. Higher internal precision can support calibration and timing even when the source has fewer bits.
A useful acceptance record includes the source format, signal range, target luminance, refresh configuration, calibration and test results. Check gradients, stepped patches and low-brightness behavior; add camera tests when filming matters. This produces a clearer purchasing decision than treating one grayscale number as a complete image-quality rating.
 Novastar VX600 Pro vs VX600: What's Actually Different
 NovaStar VX2000 Pro vs VX2000: Verify Before Buying
Related Posts

Fill In Your Needs In Detail
Fill in the screen usage scene and size you need in “Content”.You will get a quote.